
1 min read
Why EMR Integration Is a Compliance Lifesaver
💡EMR integration is a compliance lifesaver because it eliminates double entry, centralizes communication, and ensures every patient interaction is...
5 min read

An integration gets approved on a number. Somebody puts a figure in a slide and the budget moves.
That figure is usually borrowed. A vendor number, applied to a practice nobody measured, producing a return nobody checks afterward.
The earlier version of this page did exactly that. Nine figures, none of them sourced. We have taken them out.
There is a better way to build the case, and it starts by sorting the claims into three tiers.
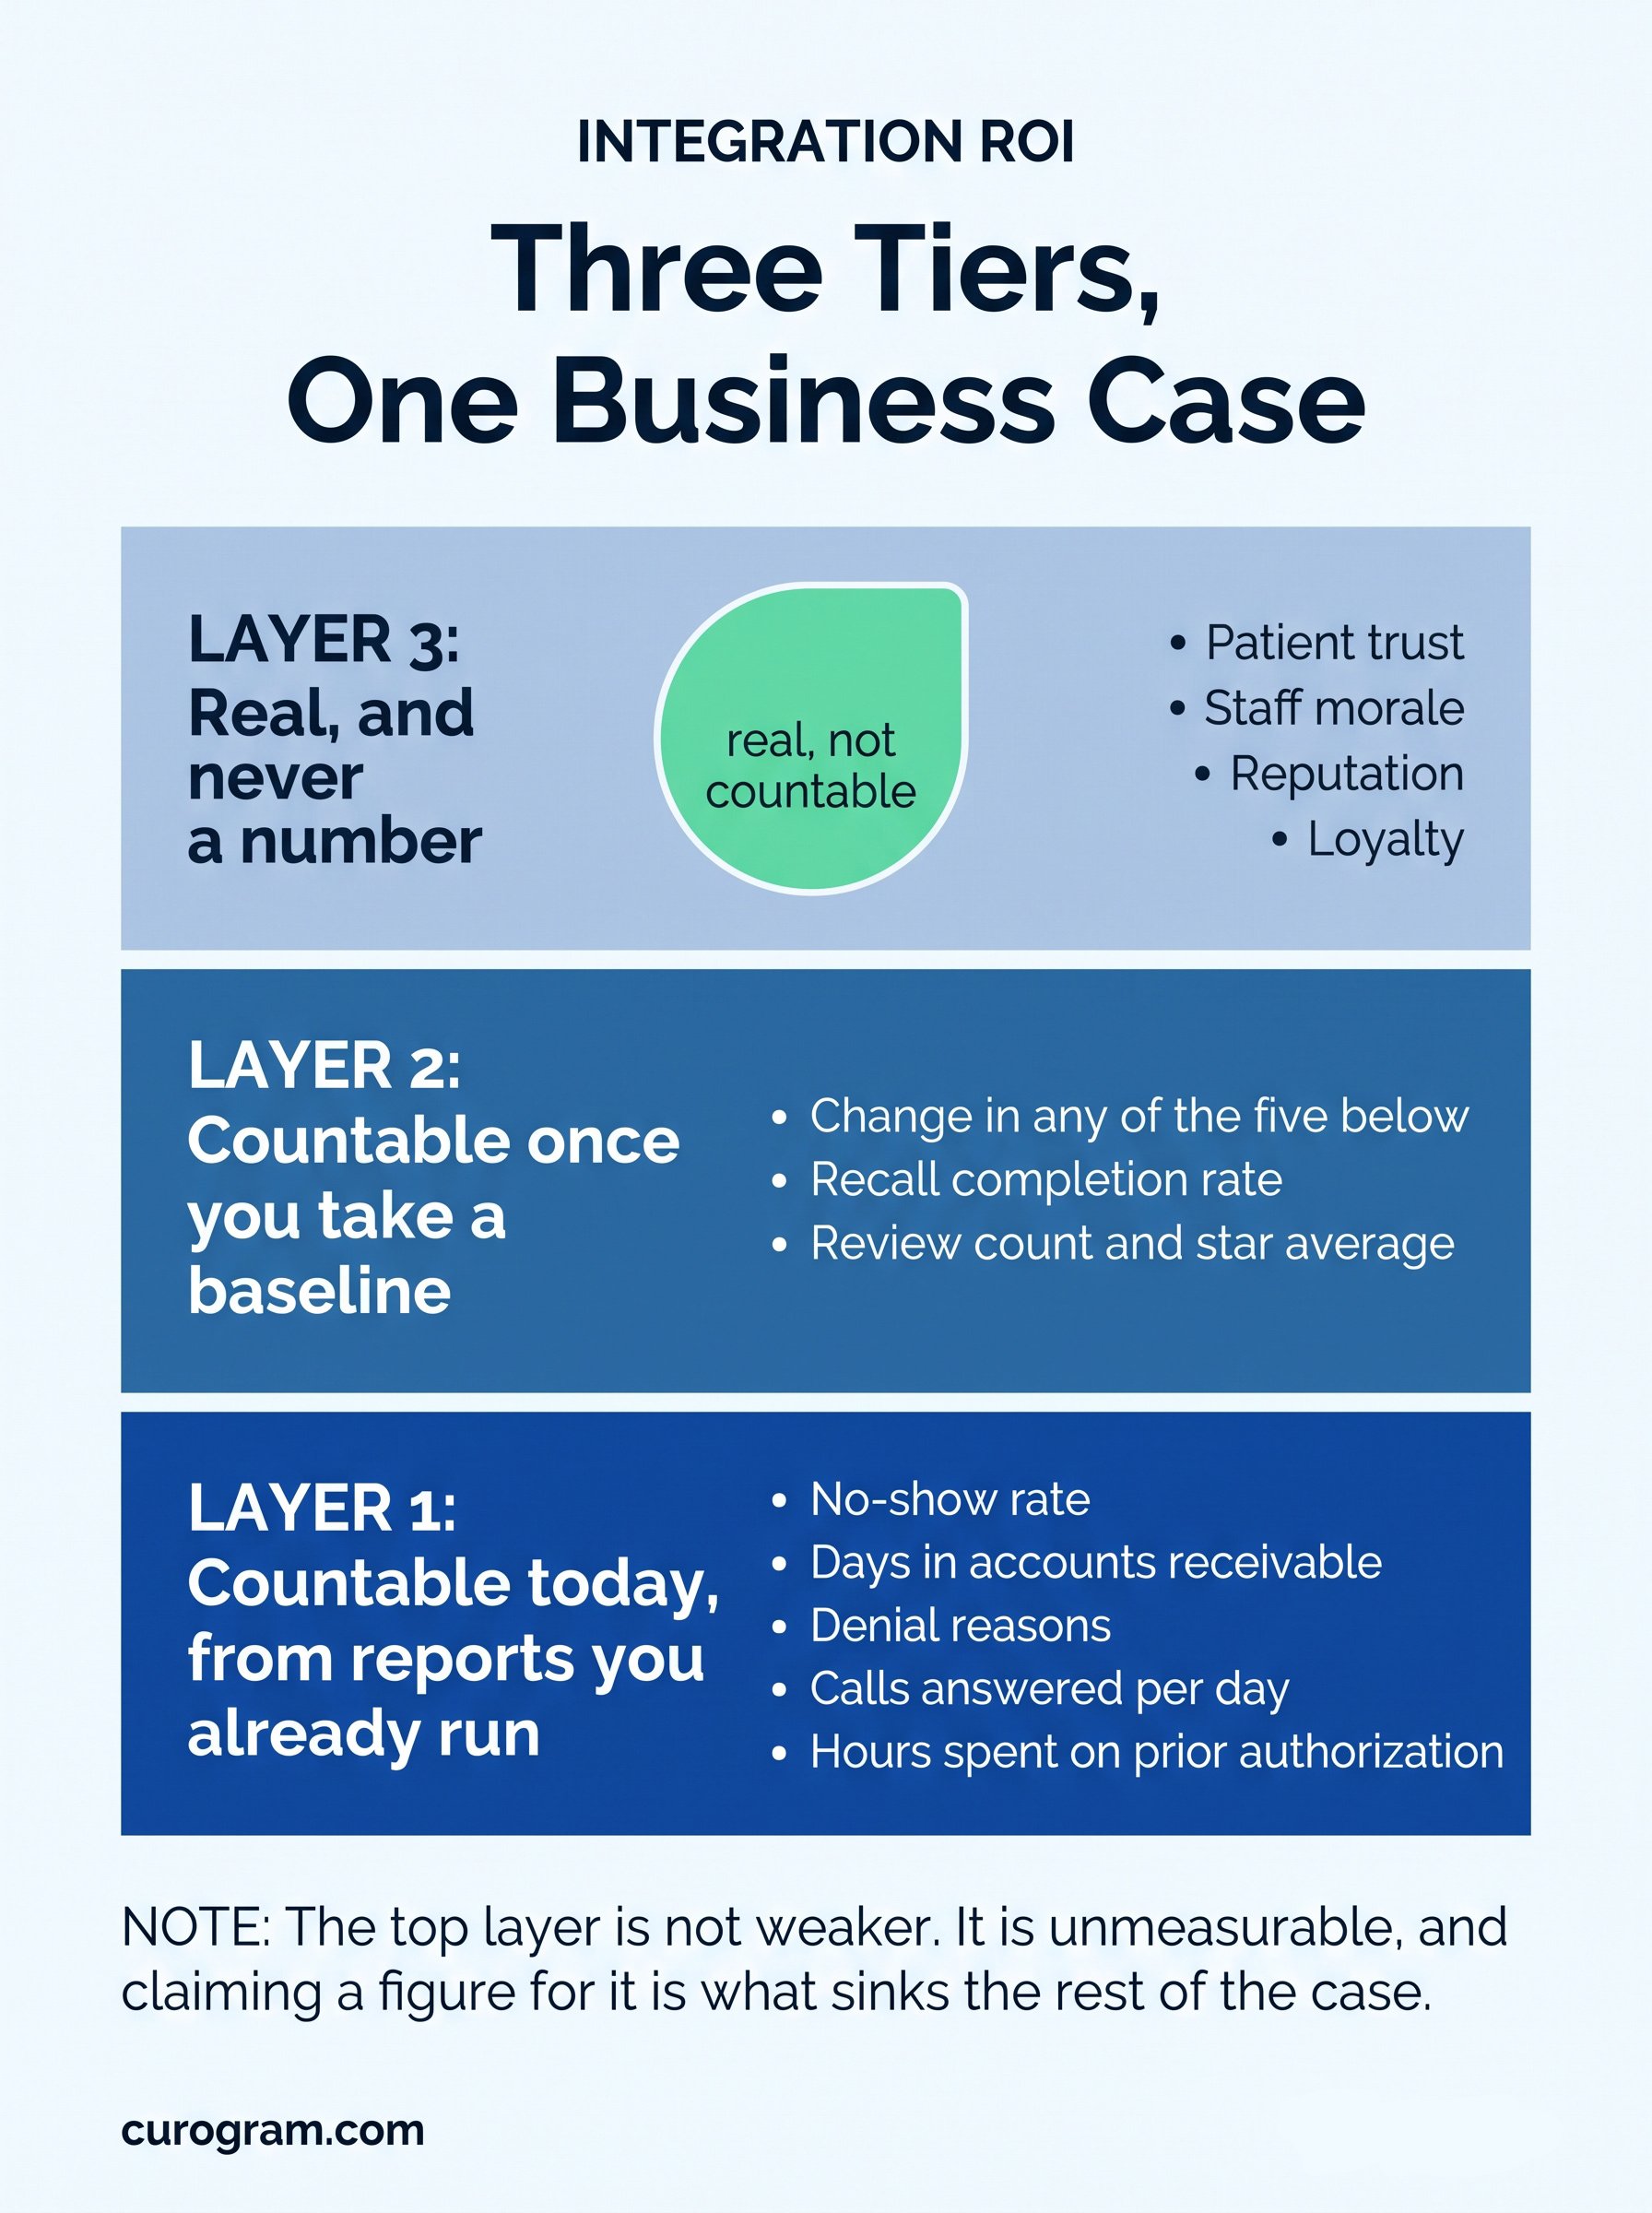
What you can count today, from reports you already run. What you can count once you take a baseline. And what is real but will never be a number.
Mixing those three is how integration business cases fall apart in the second year, when somebody asks what actually changed.
This one is countable today. Your practice management system already holds the rate, by provider and by visit type. Pull it before changing anything. A rate you did not record before the change cannot be used to prove the change worked.
Resist the per-slot revenue multiplication that usually follows. An empty slot is not lost revenue if the schedule was going to absorb it anyway.
Also countable, through the denial rate and the reason codes attached to it. Demographic and eligibility denials trace back to the front desk.
Separate those from coding denials before claiming anything. They have different owners and different fixes.
Partly countable. Calls answered per day and average hold time are both in the phone system already. Trust is not countable, and saying so is more useful than inventing a figure for it.
Volume is where the countable part lives. Our writeup of mass texting in Cloud 9 software covers what changes when one message replaces a call list.
Days in accounts receivable is the cleanest number in this whole article. It is already calculated, already trended, and already understood by whoever signs off.
Use it as the headline measure if you only get one. Finance teams argue about most metrics and accept this one.
Burnout itself is not countable. The work behind it is, and prior authorization is the clearest example. The 2025 AMA prior authorization survey asked 1,000 physicians.
Physician and staff time came to about 13 hours a week, across roughly 40 requests per physician. 95% said it delays care and 26% reported a serious adverse event.
That is a measured figure from a named survey. It is the easiest line in any integration business case to defend.
Not countable in advance, and dangerous to model. A fine that has not happened is not a saving.
What you can count is workarounds. Staff using personal phones is observable. A count of that beats a hypothetical penalty in any budget meeting.
 Where EMR Integration Creates Hidden ROI
Reminders do work, and the effect is modest. A March 2026 review and meta-analysis pooled 10 studies and 8,236 patients.
Attendance rose at a risk ratio of 1.11, with a confidence interval of 1.05 to 1.19. That is a real effect and nowhere near the figures vendors quote. The earlier version of this page claimed up to 75% fewer missed appointments. No study supports that, so it is gone.
Administrative waste is measured at industry level. The 2025 CAQH Index puts the medical savings opportunity at $18.7 billion a year. That comes from moving the remaining manual transactions to electronic.
Electronic prior authorization adoption reached 40%, up from 31% two Index editions earlier. The headroom is the point rather than the dollar figure.
Industry totals do not scale down to one practice. Use them to show the direction, then measure your own denial rate.
Countable in volume and rating, not in revenue. Review count, star average and the date of the newest one are all visible to anyone. Connecting reviews to new patients takes attribution most practices do not have. Claim the rating, not the revenue.
Turnover is countable and slow. One year of data tells you very little, because a single departure moves a small practice's rate by a lot.
Hours returned is the better proxy, and it is countable from the start. Prior authorization time and call handling time are both measurable this month.
Patient retention is the input here, and most practices do not have a rate they trust. Lifetime value calculations need one. Recall completion is the countable version. How many overdue patients came back, out of how many you contacted.
Our writeup of mass patient messaging in CureMD covers the broadcast side of that outreach.
The least glamorous item here and often the most valuable. An integration that produces a weekly report changes what gets discussed in a management meeting.
Not a line in a business case. Worth naming anyway, because it is what makes every other number on this list available.
The earlier version of this page offered two anecdotes from unnamed practices. A 50% no-show reduction and 20% fewer claim denials. Neither could be checked.
Named examples are better. Our piece on mass texting in InSync EMR covers a behavioral health center. It reported a 40% attendance increase in a month.
That figure comes from the center itself rather than from an independent study. Worth saying, because the distinction is the whole subject of this article.
Two-way reminders built from the schedule. Digital intake that writes back to the record. A shared inbox for patient messages. Text-to-pay for balances.
Each one maps to a number you already hold. Reminders to no-show rate, intake to denial reasons, the inbox to call volume, text-to-pay to days in receivables.
That mapping is what makes a business case defensible a year later.
Curogram HighlightCurogram's Mass Text Messaging sends to a list filtered from the schedule rather than an uploaded spreadsheet. Replies land in the threads staff already use, and opt-outs apply across every message type rather than campaign by campaign. Recall completion is the number to watch here. Contacted, replied, booked, attended, measured the same way every month. |

Build the case on three numbers you already hold. No-show rate, days in accounts receivable, and hours spent on prior authorization.
Record all three for a month before anything changes. That month is the cheapest part of the project and the one everybody skips.
Then name the things you are not going to measure. Trust, morale, reputation and loyalty are real and they are not line items.
Saying so protects the case rather than weakening it. A business case that claims only what it can show survives the review that kills the others.
Check back at three months, not at twelve. A change that has not moved anything by then usually never will.
Book a Curogram demo and bring those three numbers with you. Ask which report each one will come from after the integration is running.

1 min read
💡EMR integration is a compliance lifesaver because it eliminates double entry, centralizes communication, and ensures every patient interaction is...

1 min read
💡 Healthcare compliance means following the rules that protect patient data, guide billing, and keep care safe. These include HIPAA, CMS rules,...

1 min read
💡 An EMR integration success story shows what happens when patient communication connects directly to your EMR. In this case study, a small primary...