


Skip to the main content.

11 min read

Mastering Referral Patterns: Double Your Best Referral Sources

Mastering Referral Patterns: Double Your Best Referral Sources
 💡 Most medical practices lose patient feedback the moment a visit ends. A satisfied patient leaves quietly, while one frustrated patient writes a 1-star review. That gap distorts your reputation and your operations.

A patient NPS sentiment capture healthcare feedback loop fixes this. Automated surveys score every visit, then route Promoters to Google reviews and Detractors to staff for private resolution.

The result: more 5-star reviews, fewer public complaints, and provider-level data you can actually coach on.

You run thousands of appointments a year, and almost every one ends the same way. The patient walks out, says "thanks," and disappears into the parking lot. Whether they loved it or hated it, you usually have no idea.

That silence is the most expensive thing in your practice.

Because here's the math: a mid-size clinic running 8,800 visits a year generates 8,800 separate opinions about your providers, your wait times, and your front desk. Almost none of those opinions ever reach you in a usable form.

They live in patients' heads, in their texts to friends, and eventually, in the 1-star review that pops up on a Tuesday morning.

Meanwhile, the 95% who were happy say nothing. They don't post. They don't call. They certainly don't fill out a paper survey clipped to a clipboard. So your online reputation ends up shaped by the loudest 5% — not the quiet majority who actually like you.

This is the feedback gap. It's the space between what your patients experience and what your practice ever finds out about. And it costs you twice. You lose the reputation lift from happy patients you never asked. You also lose the early warning signs from unhappy patients you never heard.

A patient NPS sentiment capture healthcare feedback loop is how modern practices close that gap. It captures sentiment automatically, sorts it intelligently, and routes it to the right place — Google for the fans, your inbox for the frustrations.

Below, we'll break down how this works, why aggregate NPS alone won't save you, and what real numbers look like when the loop actually closes.

What the Silent Majority Is Costing You

Patient satisfaction is being generated every single day inside your practice. Every appointment creates an experience, an emotion, and a reaction. The problem is that almost none of it gets captured in a way you can use.

Think of those 8,800 annual visits at a mid-size clinic.

That's 8,800 raw data points about your providers, your scheduling, and your front desk experience. Without a system to capture them, they evaporate the moment the patient walks out.

The cost of that lost data is bigger than it looks. Each visit contains signals about wait times, communication clarity, billing friction, and provider rapport. Multiply that by a year, and you're missing tens of thousands of small insights that could be shaping decisions.

Most practices don't realize this is happening because the gap is invisible. There's no error message, no alarm, no missing report. Patients walk out, the schedule moves on, and the data simply never gets written down.

8,800

Annual visits generating insight. Every appointment creates a data point — whether you capture it or not.

The Two Costs of Flying Blind

Operationally, you're flying blind without structured feedback. You can't tell if satisfaction is climbing or sliding. You can't see which providers patients love or which appointment types frustrate them. You only learn about issues after they show up as no-shows, cancellations, or angry online reviews.

By that point, the damage is already done.

A no-show isn't just a missed slot — it's often a patient who quietly decided not to come back.

A 1-star review isn't an isolated incident — it's usually the surface of a problem that's been brewing for weeks across multiple patients.

The cost of that lag is real. Every patient who churns silently is a future revenue loss you'll never trace back to a single cause. Every negative review left up for months chips away at how new patients perceive you long before they ever call to book.

Reputationally, the math is even worse. The satisfied majority stays silent while the frustrated minority broadcasts publicly. A practice with thousands of happy patients can still look mediocre online because only the upset ones bothered to post. Your reputation becomes a distorted mirror — reflecting the unhappy 5%, not the 95% who walked out smiling.

And that distortion has real consequences. New patients searching for a provider rarely scroll past your star rating.

A 3.8 average tells them one story;

A 4.7 tells them another. The gap between those two numbers can mean dozens of new appointments a month.

Over a year, that gap compounds into something much bigger than a rating number. It shapes whether you grow, plateau, or quietly lose market share to a competitor down the street who simply asked the right patients at the right moment.

~150 vs. ~7,500+

Data points captured per year — without vs. with automation. Random reviews capture a sliver. Structured sentiment capture turns nearly every visit into usable data.


NPS Isn't Just a Number — It's an Operations Tool

Net Promoter Score sounds simple.

Ask one question:

"How likely are you to recommend this practice?"

Score 0 to 10. Group the answers.

What makes NPS useful isn't the score itself. It's the behavior it predicts. The score is really three different patient groups in disguise.

And each group behaves very differently after they leave your office:

  • Promoters (9–10): Refer friends, leave 5-star reviews, and stay loyal.
  • Passives (7–8): Content but quiet — won't actively recommend or review you.
  • Detractors (0–6): Likely to churn and the most prone to vent publicly.

The reason this grouping matters is that each group requires a different response. Promoters need to be activated. Passives need to be nurtured. Detractors need to be heard before they become a problem. Treating all three the same wastes the data entirely.

Most practices that "do NPS" stop at collecting the score. They look at the average, file it in a quarterly report, and move on. That's why the metric ends up feeling useless — the value isn't in the number, it's in what you do with the three groups behind it.

Why the Aggregate Score Lies

This is where patient NPS score medical practice tracking becomes operational. An aggregate NPS of 7.8 looks fine on a dashboard. But that single number can hide a serious gap. Provider A might be scoring 9.1 while Provider B is sitting at 5.4. The average tells you nothing about who needs help.

Worse, the aggregate can stay stable while the underlying performance is shifting. A new provider quietly underperforming gets balanced out by a veteran whose patients adore them. You feel calm because the number looks calm. Meanwhile, churn is climbing on one side of the practice.

This is why aggregate-only reporting fails at scale. The bigger your practice gets, the more an average smooths out the very signals you need to see.

A two-provider clinic might be able to feel a problem coming.

A ten-provider clinic won't — not without breaking the score apart.

Without provider-level attribution, NPS is just decoration.

With it, healthcare net promoter score implementation turns into a real performance tool — one that points directly at the providers and workflows driving your numbers up or down. That shift in granularity changes how you run the practice, replacing annual reviews and anecdotes with a live feed of patient sentiment that updates with every visit.

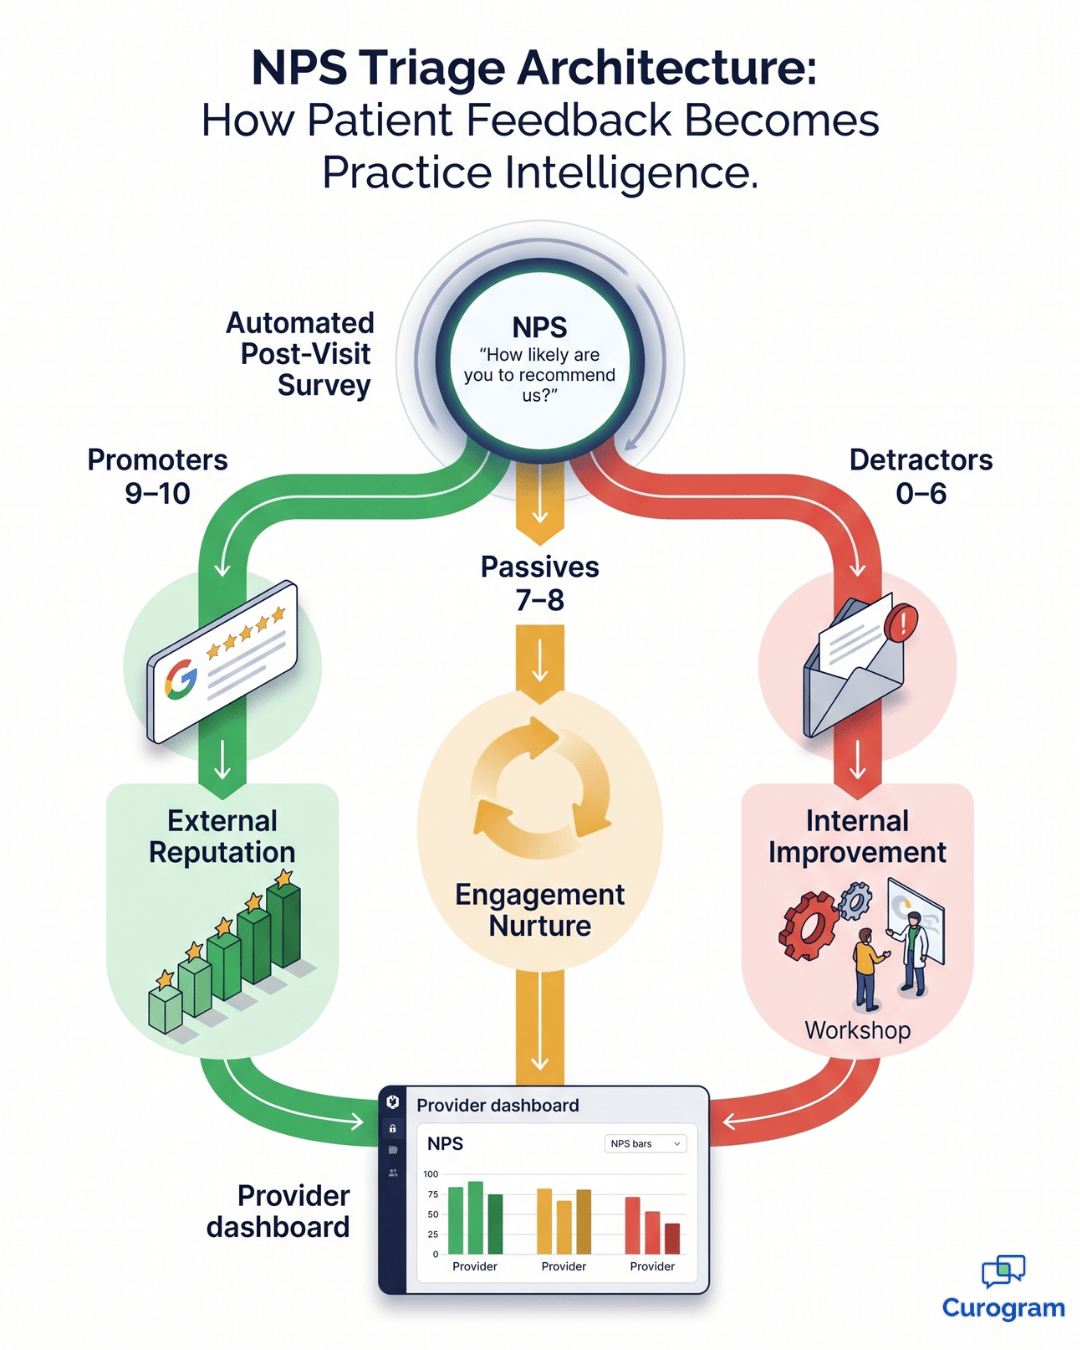
NPS triage architecture routing patient feedback to Google reviews, nurture, and admin alerts

Sorting Sentiment So It Works Both Ways

Capturing sentiment is only step one. What you do with it is where the value lives.

A smart post-appointment sentiment capture healthcare workflow doesn't treat all feedback the same. It sorts responses by score and sends them in different directions. Promoters get routed toward your public reputation. Detractors get routed toward your private operations.

The logic is straightforward. The patients most likely to say something nice online are the ones who already feel good about you. The patients most likely to need a personal touch are the ones who left frustrated. A good system meets each of them where they already are.

Here's what that looks like in practice:

Patient Score Group Where the Feedback Goes
9–10 Promoter Invited to leave a Google review
7–8 Passive Added to an engagement or nurture flow
0–6 Detractor Sent privately to admin with an alert

This dual routing creates a system that's structurally tilted in your favor. You convert quiet satisfaction into visible 5-star reviews. You also intercept frustration before it lands on Google.

What makes the design work is timing. The survey hits the patient while the visit is still fresh — usually within a few hours — when their impression is sharpest and they're most willing to respond. By the next day, half of what they felt has already faded into the background of their week.

<5% vs. ~90%

Promoters converted to reviewers — without vs. with prompting. Happy patients rarely leave reviews on their own. A timely ask changes everything.

What Happens to Each Group

Think about how rarely this happens by accident.

A happy patient might think about leaving a review, then get busy and forget.

An unhappy patient, on the other hand, often goes straight to the search bar.

Without a system in between, the wrong voices always win.

The numbers back it up. Roughly 90% of patients who indicate 4–5 star satisfaction in a survey will leave a 5-star Google review when prompted.

In a busy clinic, that can translate to over 1,000 new 5-star reviews in a single quarter — without anyone manually asking. That kind of review volume isn't just vanity. It directly affects how often your practice shows up in local searches, how high you rank against competitors, and how quickly new patients trust you before they've ever walked in.

And the Detractor side matters just as much. That feedback doesn't vanish or escalate. It lands with the right person, gets a response, and often saves the patient before they churn. That's what patient satisfaction survey automation actually means: not just collecting data, but acting on it the same day.

The Detractor alert also creates a paper trail. You know who flagged a problem, what they said, who responded, and what changed. Over time, that record turns scattered complaints into operational intelligence — the kind that helps you fix patterns instead of putting out fires.

<10% vs. 90%+

Detractors heard before they post publicly. Without capture, most frustrated patients vent on Google first. With it, they reach you first.

A single same-day call to an upset patient can turn a churn risk into a long-term relationship. Multiply that across a year, and you're protecting both revenue and reputation at the same time.

Coaching With Data Instead of Guesswork

Aggregate scores tell you how the practice is doing. Provider-level scores tell you what to actually do about it.

Consider one real-world scenario. A clinic implemented provider-level NPS tracking and found its overall score was 7.8 — respectable on paper. But once they broke it down, two providers were scoring above 9, and one was scoring 5.2. The average had been hiding a serious problem.

Without that breakdown, leadership might have spent another year assuming everything was fine. Instead, they had a clear picture within the first month of tracking. Even better, the survey data showed exactly where the gap lived. Clinical competency scores for the low performer were strong. Communication scores and wait time perception were not.

The problem wasn't medicine — it was the patient experience around it.

That distinction matters enormously. A provider with weak clinical scores needs a very different intervention than one with weak communication scores. Without the granularity, leadership would have either treated the symptom too broadly or — more likely — done nothing at all.

Clinic leaders reviewing patient NPS trends on a wall display in a strategy meeting

From Vague Feedback to Coachable Habits

That's coachable. Instead of vague "improve patient satisfaction" feedback, the practice manager could have a specific conversation about communication style and time management. The conversation became less about criticism and more about a few measurable habits.

The high performers, meanwhile, became the model.

A few specific behaviors kept showing up in their feedback again and again:

  • Afternoon scheduling slots that reduced rush-related wait times
  • A short follow-up call after the visit to check on the patient
  • Specific phrasing during the visit that made patients feel heard

These weren't personality traits. They were habits, which meant they could be studied and copied across the team. What used to be invisible talent became a replicable playbook — and performance conversations became less personal and more productive, because everyone was looking at the same numbers.


There's also a cultural shift that comes with this kind of transparency.

When providers know their NPS is tracked and visible, the conversation around patient experience stops feeling like a soft topic.

It becomes part of how performance is measured — alongside clinical outcomes and productivity — and that alone tends to lift scores across the board.

Turning Feedback Into an Always-On Improvement Engine

The real payoff isn't a single insight. It's the loop running month after month.

When you track NPS continuously, small shifts become visible early. A provider whose score drops 0.8 points month-over-month is sending you a signal. Maybe they picked up evening shifts and wait times grew. Maybe a new MA needs more onboarding. Either way, you see it in week three instead of month six.

That early visibility changes everything about how problems get solved. A small dip caught in real time usually takes a 15-minute conversation to fix. The same dip caught six months later usually takes a turnaround plan, a few lost patients, and a damaged provider relationship.

The same logic applies to positive signals. A small lift in one provider's score after a workflow change is the kind of evidence you can use to roll that change out everywhere. Without continuous tracking, those wins go unnoticed and unrepeated.

Spotting Patterns Anecdotes Always Miss

Detractor feedback, captured consistently, also starts revealing patterns. If three different patients mention wait times in the same week, it's not personality — it's a process problem. If multiple Promoters mention the same follow-up call after their visit, that's a habit worth standardizing across every provider.

These patterns are nearly impossible to spot without structured data. Anecdotes feel random. Aggregated sentiment shows you the trend lines. And once you see a trend, you can act on the root cause instead of chasing one-off complaints that never quite add up.

This is how you close patient feedback loop medical workflows for good. Not with a one-time satisfaction survey, but with a continuous system that captures sentiment, sorts it, acts on it, and feeds the results back into how the practice operates.

Reputation is the visible output. But the real win is what happens upstream — a practice that gets a little sharper every month because it's actually listening.

Over a year, those small improvements compound. Wait times shrink. Communication scores climb. The whole patient experience gets quietly stronger without any dramatic overhaul.

Conclusion

The longer your feedback gap stays open, the more your reputation gets shaped by people you'll never get a chance to win back. Every week without a capture system is another 150–200 visits worth of insight you'll never see.

The good news: closing it doesn't require a new department or a months-long rollout. It requires a system that asks the right question at the right time, sorts the answers automatically, and puts the data in front of the people who can act on it.

That's exactly what Curogram's Insight Suite is built to do. It runs automated post-visit surveys, scores every response, and routes Promoters to Google while sending Detractors straight to your admin team. You get provider-level NPS dashboards, real-time alerts when sentiment drops, and a steady stream of public reviews — without your staff lifting a finger.

Practices using this approach typically see Google review volume climb sharply within the first 90 days. They also see something less visible but more valuable: a sharper sense of how each provider is actually performing, and an early warning system for problems that used to surface as cancellations.

There's a quieter benefit too. Front desk and admin teams stop spending time chasing surveys, manually asking for reviews, or fielding surprise complaints. The system handles the routine work, and your staff gets to focus on the patients in front of them.

If your current process for measuring patient satisfaction involves a clipboard, a quarterly email blast, or nothing at all, you're leaving real money and real reputation on the table. There's a better way to know how your patients feel — and to act on it before they decide whether to come back, or tell the internet what they thought.

Book a demo with Curogram and see how the Insight Suite turns every appointment into actionable data. Your next 1,000 reviews are already being written in your patients' heads. The only question is whether you'll hear about them.


Frequently Asked Questions

How often should we capture NPS to spot real trends?

Weekly or appointment-triggered capture works best for trending. Monthly rollups are fine for spotting bigger patterns, but quarterly is too slow — by the time you see a dip, you've lost months of patients. Since every appointment can generate a data point automatically, weekly aggregation gives you a clear view of provider and day-of-week trends without needing huge sample sizes.

What if our initial NPS scores are low? Should we share them publicly?

No. NPS is an internal operations metric, not a marketing number. Use the data to drive coaching and process changes. The public version of your improvement shows up naturally over time as your Google rating climbs and your review count grows. Patients don't need to see your NPS — they need to feel the improvements it drives.

Can multi-location practices benchmark NPS across sites?

Yes, and this is where provider-level tracking gets especially powerful. You can compare overall NPS by location and also see how individual providers perform across different sites. One provider might score 9.1 at Location A and 8.4 at Location B (both strong). Another might score 6.8 at Location A and 5.1 at Location B, signaling a real gap that needs attention.

How is sentiment capture different from a regular patient satisfaction survey?

A traditional survey collects answers and stops there. Sentiment capture sorts those answers in real time and triggers an action — a Google review request for happy patients, an internal alert for unhappy ones. The data doesn't just sit in a report; it moves the practice forward the same day.

Does automated sentiment capture stay HIPAA-compliant?

Yes, when it's built on a HIPAA-compliant platform. Surveys go out through secure channels, responses are stored safely, and only authorized staff see Detractor alerts. The automation handles the workflow; the compliance layer handles the protection.