
 Aubreigh Lee Daculug
The Connection Between Online Ratings and New Patient Volume
💡 A 4.2-star aggregate rating can hide a serious problem. One provider scoring 4.8 and another scoring 3.1 average out to "satisfactory" — but the...

Your front desk closes at 6 PM. A patient walks out happy, tells two friends about you over dinner, and forgets your name by Friday. You never hear about any of it.
That same week, one frustrated patient leaves a 1-star review at midnight. Now that review sits at the top of your Google profile for the next 18 months.
This is the feedback gap. And it quietly shapes how every new patient sees your practice before they ever call.
Most medical practices generate thousands of patient experiences a year. A mid-size clinic with 8,800 annual visits creates 8,800 reactions, opinions, and stories. Almost none of them are captured. The satisfied 95% stays silent. The unhappy 5% takes the microphone.
You end up running a clinic with no real visibility into patient sentiment. You can't tell which provider is pulling scores down. You can't tell which workflows trigger frustration. You can't tell if last month was better or worse than this one. You're managing reputation through guesswork.
The fix isn't another survey form buried in an email no one opens. It's a structured patient NPS sentiment capture healthcare feedback loop that turns every visit into a usable signal, then routes that signal to the right place automatically.
In the next few sections, you'll see how Net Promoter Score becomes an operational tool, how sentiment triage protects your reputation in both directions, and how provider-level data turns vague "patient satisfaction" into something you can actually coach to. You'll also see the math behind why 1,064 new 5-star reviews in 90 days isn't luck.
It's a system. Let's break it down.
Patient satisfaction is created the moment a visit ends. Every appointment leaves behind an opinion, a feeling, and a likelihood to return. Most of that data dies in the parking lot.
When patients feel good about a visit, they rarely tell you. They tell their spouse. They tell a coworker. They might recommend you next month, or they might forget by next week. Either way, that positive signal never reaches your practice in any structured form.
Now flip the script. When patients feel ignored, rushed, or disrespected, the response is louder and faster. Frustrated patients post reviews. They call to complain. They cancel their next appointment instead of responding to smart reminders. Some never come back at all.
This silence creates two compounding problems for your practice. The first is operational. The second is reputational. Both quietly drain revenue.
Closing this gap is the entire point of post-appointment sentiment capture healthcare workflows. You need to capture the silent majority before they forget, and catch the frustrated minority before they tweet.
Net Promoter Score isn't a satisfaction grade. It's a behavior predictor. It asks one simple question:
"How likely are you to recommend this practice to a friend or family member?"
Patients answer on a 0–10 scale.
Every NPS response sorts your patients into one of three behavioral groups. Each group reacts differently to your practice and has a different impact on your future revenue.
| Score | Group | What It Means for You |
|---|---|---|
| 9–10 | Promoters | Will refer, will leave 5-star reviews, lifetime value is high |
| 7–8 | Passives | Satisfied but quiet, won't refer, won't post |
| 0–6 | Detractors | Churn risk, complaint risk, public review risk |
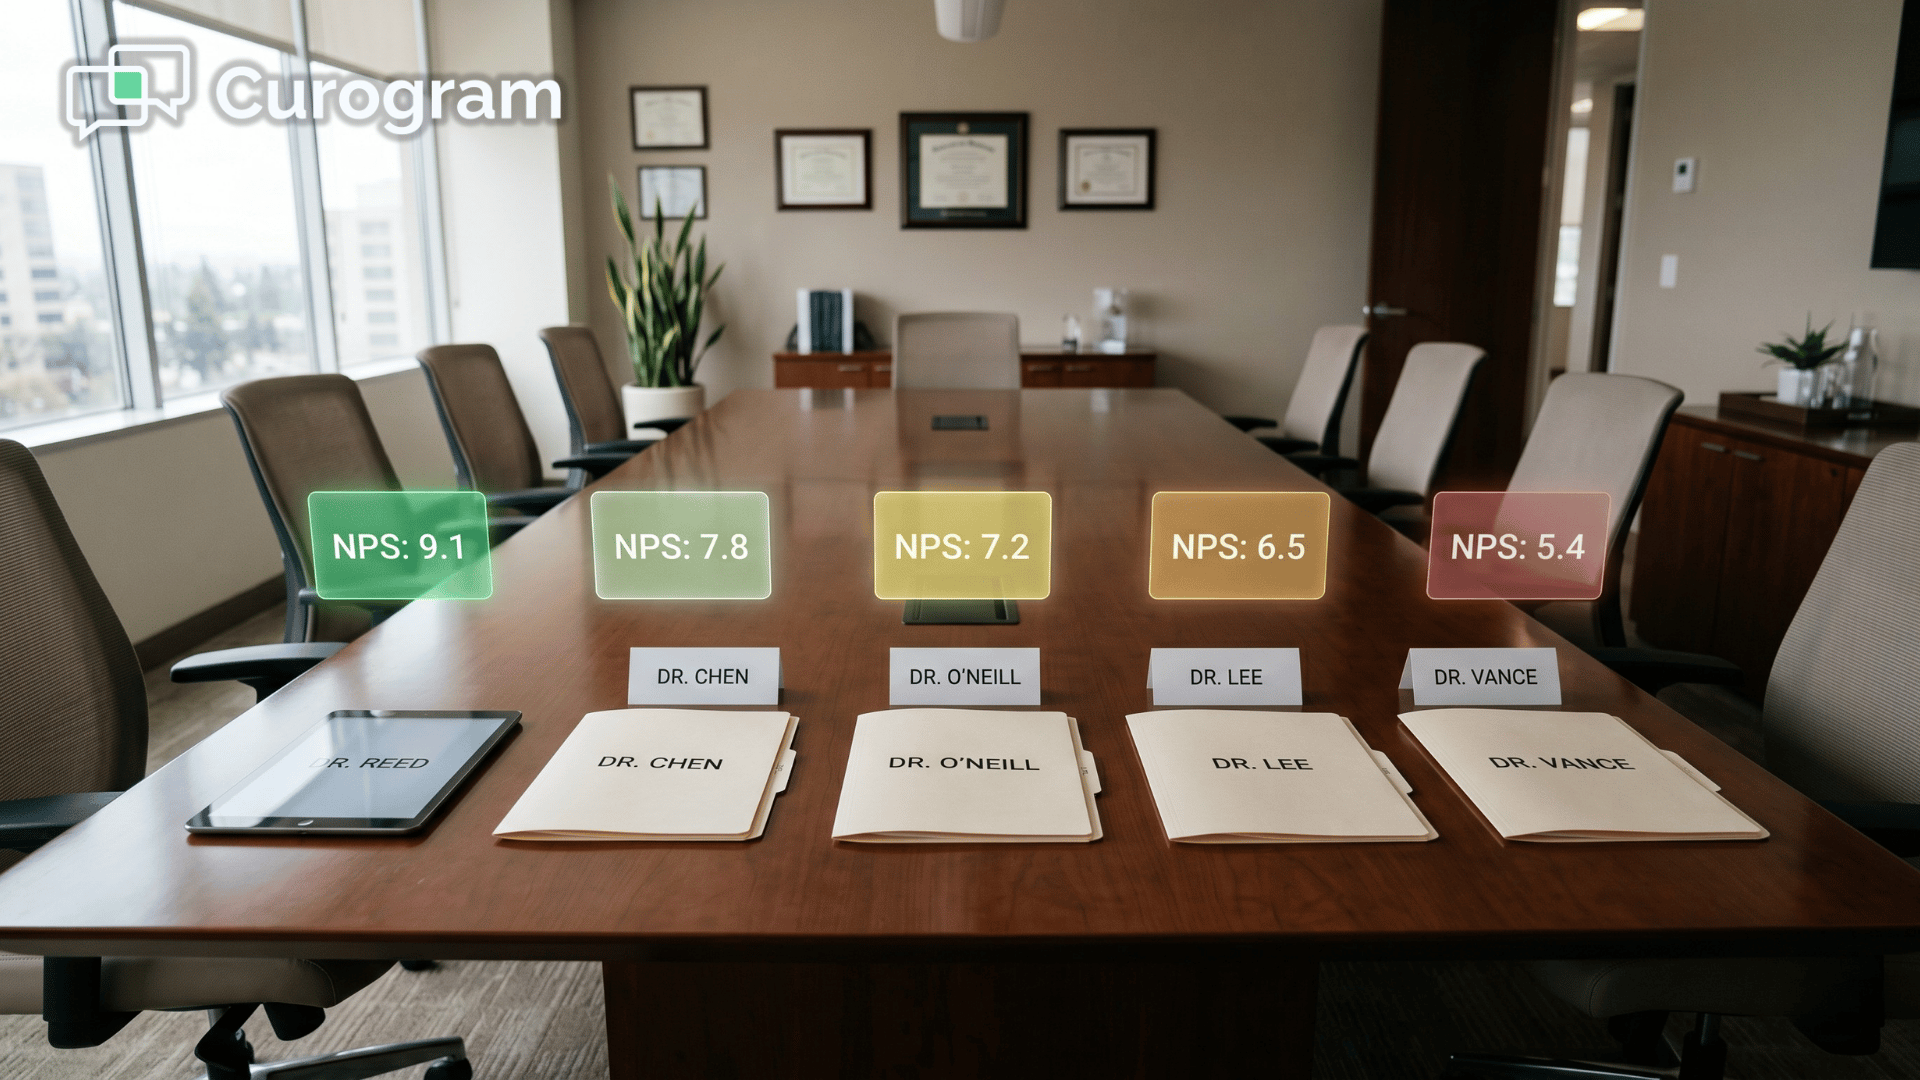
A practice-wide patient NPS score medical average sounds useful until you look closer. Imagine a clinic with an aggregate NPS of 7.8.
On paper, that's fine. In reality, it could hide one provider scoring 9.1 and another scoring 5.4. The average lies. The provider-level numbers tell the truth.
This is where healthcare net promoter score implementation moves from a vanity metric to an operational tool. When you track NPS by provider, by location, by appointment type, and by week, you suddenly see the gaps that matter. You stop guessing. You start coaching with medical practice analytics software.
Aggregate scores tell you how the practice feels. Segmented scores tell you what to do next.

A working feedback loop doesn't just collect sentiment. It routes it. The whole point is to make sure the right response goes to the right place automatically, within minutes of the visit ending.
Each NPS group should trigger a different action the moment the survey is submitted.
The system handles routing in the background so your team never has to sort responses manually.
This dual closure structurally biases your reputation in your favor. Happy patients are guided toward visibility. Unhappy patients are intercepted before they become a 1-star review. The system protects the upside and contains the downside.
The numbers back this up. One Curogram client running this exact triage saw 90% of surveyed patients who reported 4–5 star satisfaction go on to leave 5-star Google reviews. The 90-day total was 1,064 new 5-star reviews. That isn't a marketing fluke. It's the math of patient satisfaction survey automation working at scale.
But the deeper value is on the detractor side. Every captured complaint is a complaint that didn't go public. Every flagged issue is a coaching opportunity, a workflow fix, or a chance to rescue a patient relationship before it ends.
Closing the loop means you hear bad news first, in private, while you can still do something about it.

Aggregate scores let you sleep at night. Provider-level scores wake you up in a productive way.
Consider this scenario. A clinic with five providers carries an aggregate NPS of 7.8. Leadership assumes performance is even. After implementing provider-level tracking, the picture changes fast. Two providers score above 9.0. Two hover around 7.5. One sits at 5.2.
That 5.2 isn't a mystery anymore once you look at the underlying sentiment data. Clinical competency scores are strong. Communication scores are weak. Wait time perception is the lowest in the group.
Now the conversation with that provider is specific. It's not "patients aren't happy." It's "your clinical work is rated highly, but communication and pacing are pulling your scores down. Here's the data, here's the pattern, here's what your top-rated colleagues are doing differently."

The flip side is just as valuable. The two top performers become a model. Maybe they always do a 30-second recap at the end of every visit. Maybe they always send a follow-up text the next day. Once you find the pattern, you replicate it across the practice.
Here's a sample comparison of what that data can reveal:
| Provider | NPS | Strength | Gap |
|---|---|---|---|
| Dr. A | 9.4 | Communication, follow-up | None significant |
| Dr. B | 9.1 | Wait time management | Minor scheduling issues |
| Dr. C | 7.6 | Clinical depth | Limited small talk |
| Dr. D | 7.4 | Friendliness | Rushed explanations |
| Dr. E | 5.2 | Clinical accuracy | Communication, pacing |
For your team, this means coaching conversations stop being subjective. They become evidence-based. And when one provider shifts from 5.2 to 7.5 over two quarters, you can prove the lift in dollars retained and reviews gained.
A feedback loop only earns its name when the data drives action on a regular cycle. One-time surveys gather dust. Live, ongoing capture changes how you run the practice.
The right rhythm depends on how quickly you want to spot trends.
Most practices that get strong results from closing the patient feedback loop medical workflow follow a simple, layered schedule.
Imagine one of your providers drops 0.8 points month-over-month.
That's an early warning, not a catastrophe. You investigate and find they recently picked up evening shifts, which extends wait times. The fix is targeted: rebalance the schedule, set patient expectations, or adjust the appointment buffer. Six weeks later, the score recovers.
Detractor feedback works the same way. If three different patients in two weeks mention the same issue, that's not a personality clash. That's a system problem. Maybe your check-in workflow is broken. Maybe a specific appointment type runs over consistently. Now you have a target.
Promoter feedback is just as actionable. If happy patients keep mentioning the same thing, you've found a replicable behavior. Standardize it. Train new staff on it. Make it part of your operating model.
To put real numbers behind this: a practice that lifts NPS by even 5 points typically sees a measurable bump in retention.
If your average patient lifetime value is $1,200 and you retain 30 more patients a year because of better experience, that's $36,000 in protected revenue annually. Add review-driven new patient acquisition on top, and the loop pays for itself many times over.
This is the real return on closing the loop. Not just a higher star rating, but a practice that learns from itself every single week.
The hardest part of running a patient-centered practice isn't caring about the experience. It's measuring it. Most practices have no shortage of effort. They have a shortage of signal.
Every visit your team works hard to deliver should generate a usable data point. Every happy patient should have a clear, frictionless path to share their experience publicly. Every unhappy patient should be heard privately, fast, before frustration becomes a public review or a churned account.
Curogram's Insight Suite makes this whole loop run automatically. Post-visit surveys go out without front desk involvement. Promoters are routed to Google. Detractors are routed to your admin team with full context. Provider-level dashboards and patient analytics software turn sentiment into something you can coach, benchmark, and improve over time.
You don't need to add more work to your team. You need a system that captures what's already happening and uses it.
The practices that win the next decade won't be the ones with the loudest marketing. They'll be the ones with the tightest feedback loops. The ones who hear from satisfied patients first, fix issues quietly, and build reputations on real experience instead of marketing spend.
If you're ready to see what your real patient sentiment looks like, and what you can do with that data once you have it, Curogram is built exactly for that.
Book a demo today and walk through your own practice data with our team. You'll see how patient NPS sentiment capture healthcare feedback loop systems can lift your review volume, sharpen your provider performance, and protect revenue you didn't even know was leaking.
Frequently Asked Questions

💡 A 4.2-star aggregate rating can hide a serious problem. One provider scoring 4.8 and another scoring 3.1 average out to "satisfactory" — but the...
💡 A 4.2-star practice rating can hide a 3.1-star provider. Aggregate ratings average high performers against low ones, masking real performance...
💡 Most medical practices lose patient feedback the moment a visit ends. A satisfied patient leaves quietly, while one frustrated patient writes...