
 Jo Galvez

Median response time for every location and every queue. A group view that shows which site answers in an hour and which takes days.
Shared queues and cross-location coverage, so a lean site doesn't fall behind. Threads that carry the patient's visit context, so fast answers are also correct ones
Groups that see response time per location can fix it per location. Patients notice before the owner sees it in retention numbers.
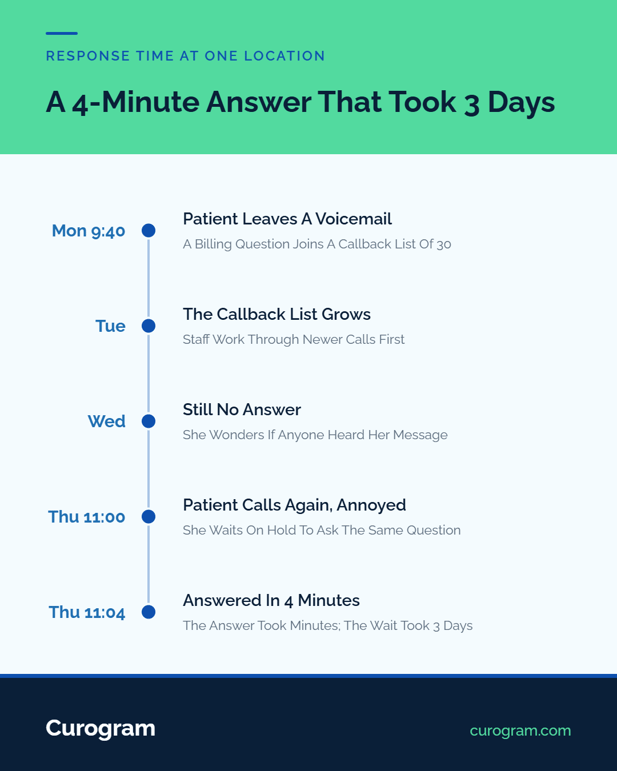
A patient leaves a voicemail on Monday with a question about her bill. By Wednesday, nobody has called back. On Thursday, she calls again, annoyed, and waits on hold.
The answer takes a staff member four minutes. The delay took three days, and it cost the group some of the goodwill it paid to build when it won that patient in the first place.
Nobody at that location decided to be slow. The voicemail sat on a callback list behind 30 others, and no report anywhere showed how long it waited.
Patients grade every location on how fast it answers, and a growing group should keep the same score. Once response time is visible per site, it becomes a number with an owner, and it starts to move.
The Villain: The Three-Day Callback
No one designed the three-day callback. It builds up when phones ring faster than staff can answer, and nothing measures the wait.
What Patients Compare You To
Patients measure your front desk against their bank's app and their pharmacy's refill texts, which answer in minutes.
Against that yardstick, a two-day callback reads as neglect. How long each patient waits for callback, practice by practice, rarely shows up in any report the owner reads.
How One Group Can Feel Like Three
Illustrative figures, median wait for an answer to a routine question:
|
Location |
Median Wait |
How Patients Reach It |
|---|---|---|
|
Cedar |
38 minutes |
Text, answered by the front desk |
|
Birch |
5 hours |
Voicemail, returned from a callback list |
|
Aspen |
1.5 days |
Voicemail, returned when someone is free |
Same group, same brand, very different patient experience by location. Patients who use Aspen once judge the whole group by it.
Response Speed, Patient Loyalty, and the Quiet Exit
When patients switch practices, slow communication is rarely the reason they give out loud. They just book somewhere else next time.
A 2024 Accenture survey of 8,000 U.S. adults, reported by the AHA, found about one in five switched providers in the past year. Nearly 90% of those who switched said the organization was hard to do business with.
The Guide: The Network Scoreboard
Curogram makes the wait patients feel into a number someone owns. It works alongside Tebra through our Tebra integration, so the schedule and records stay in Tebra.
What Gets Tracked
Every text thread has a clock on it. Curogram measures how long each one waits for a first answer, by location and by queue, such as scheduling, billing, or refills.
Those times roll up into a median per site. The owner sees Cedar, Birch, and Aspen side by side, the same way our per-location response dashboards show every other metric.
How the Number Comes Down
The shared inbox is what brings the number down:
- Claiming: a staff member takes a thread, so two people don't answer it and none forget it.
- Routing: billing questions go to billing, and scheduling questions go to the front desk.
- Cross-location coverage: when Aspen's two-person desk is swamped, Cedar's team picks up its overflow.
A billing question texted to Aspen on Monday gets claimed by Cedar's billing lead at 10 a.m. and answered by 10:15.
Why Text Makes Fast Cheap
A callback takes a staff member off the front desk for a full phone call. A text answer fits between check-ins.
Threads also carry the patient's visit details, so staff answer from context instead of looking up the chart first. Fast answers end up being better-informed answers.
Curogram Highlight: Response-Time Tracking
Response-Time Tracking measures how long patients wait for a first answer at every location and in every queue. The owner sees each site's median side by side, and managers see their own.
The tracking sits inside the same shared inbox staff already work from, with claiming, routing, and cross-location coverage built in. When a site's median slips, the fix is in the same place as the number.

The Success: The Group That Answers
Based on our internal data, Curogram clients run no-show rates 53% lower than industry benchmarks.
From "We'll Call You Back" to "Answered Before Lunch"
With routine questions moved to text, the callback list shrinks. We treat a same-day answer expectation as the floor, and same-morning as the goal.
Every location's median sits on the weekly view. When Aspen drifts from 40 minutes to 3 hours, the owner sees it the following Monday.
What Patients Say Afterward
Patients start describing the group as easy to reach. That phrase tends to show up in reviews, where other patients read it while choosing a location.
In our experience, communication speed, retention, and review tone move together. Aspen's patients stop comparing it to Cedar because the wait is the same.
Where This Connects
For the full group scoreboard these response times feed, see our guide to location-level patient engagement reporting for Tebra groups. Responsiveness also shapes what reviews say, which our piece on location-level reputation management covers.
Conclusion: Answer Speed Is a Brand Promise
Patients already grade your response times. The owner should see the same grade, site by site.
Tebra holds the record of each visit. Curogram covers the patient's experience between visits, starting with how fast someone answers.
This week, leave a voicemail question at your busiest location and time the answer. That wait is what your patients live with.
Book a demo, and we'll show per-location response dashboards on live-style data.
Frequently Asked Questions