

6 min read

Network No-Show Reduction Playbook for eCW | Curogram

Network No-Show Reduction Playbook for eCW | Curogram
💡Reducing no-show rates across eClinicalWorks multi-location groups starts with a number most networks never run. Each site loses an estimated $20,000 to $30,000 a month to missed visits.

The gap between your best and worst site proves the problem is fixable, not permanent. One location does something the others never learned.

Curogram makes that reminder sequence the network default. Patients confirm, cancel, or reschedule by text reply, and each status writes back to the eCW schedule at once. Groups on this model run no-show rates 53% below the industry average.

Your best location runs a 6% no-show rate. Your worst runs 19%. Same brand, same training, same eCW build, and nobody at the network level can explain the difference.

That gap is not random variation. It is a signal that one site figured out something the others never learned, and because no single person owns the number across the group, the lesson stays trapped inside one office.

Meanwhile, the money keeps walking out the door. Estimates put missed appointments at $20,000 to $30,000 per practice, per month. Multiply that across ten sites and you get a loss that would trigger an emergency board meeting if it ever appeared as one line item.

It never appears that way, because it hides inside ten separate P&Ls, each small enough to wave off as a rough month.

Call it the Five-Figure Leak.

Here is what makes the leak so stubborn.

Every site manager already believes they are handling no-shows, because they have a reminder running and somebody occasionally calls the difficult cases. So when a regional director asks about it, the answer is always some version of "we're on it."

They are on it. They are simply on it alone, working from local habits that nobody measured, documented, or copied next door.

What follows is a working playbook for operations leaders who are tired of running ten projects to solve one shared problem. It covers how to price your real per-site loss, why local fixes never compound into network gains, and how a single governed reminder sequence replaces a scattered mess with one lever you can actually pull.

You will not need a new EHR. You will not need to retrain every front desk either.

You will need one owner, one sequence, and one weekly number nobody is allowed to look away from.

The Money Walking Out of Your Network Every Month

Every clinic in your group counts arrivals. Almost none of them price the absences.

That single blind spot is why the leak survives. Arrivals land in production reports. Non-arrivals land nowhere, and what never reaches a dashboard never gets an owner.

One prospect counted 222 no-shows in a single month at one practice. Not a bad quarter. One month, one location. At network scale, that is a whole clinic's worth of capacity vanishing while everyone stays busy.

So run the math your finance team has never been asked to run. Start by computing the eCW no-show cost per location, then stack the sites side by side.

Sites in group No-shows per site monthly Average visit value Monthly loss Annual loss
1 150 $150 $22,500 $270,000
5 150 $150 $112,500 $1,350,000
10 150 $150 $225,000 $2,700,000

These are illustrative figures built on sample inputs, not verified client results. Swap in your own visit value and volume and the shape of the problem holds anyway.

Here is what that means in practice.

A ten-site group at these numbers writes off more than $2.7 million a year in revenue leakage missed appointments create quietly, month after month, without a single alarm going off.

The damage does not stop at the invoice, either. Empty slots distort the schedule utilization multi-site group leaders report to their boards, so provider capacity looks healthy on paper while chairs sit cold.

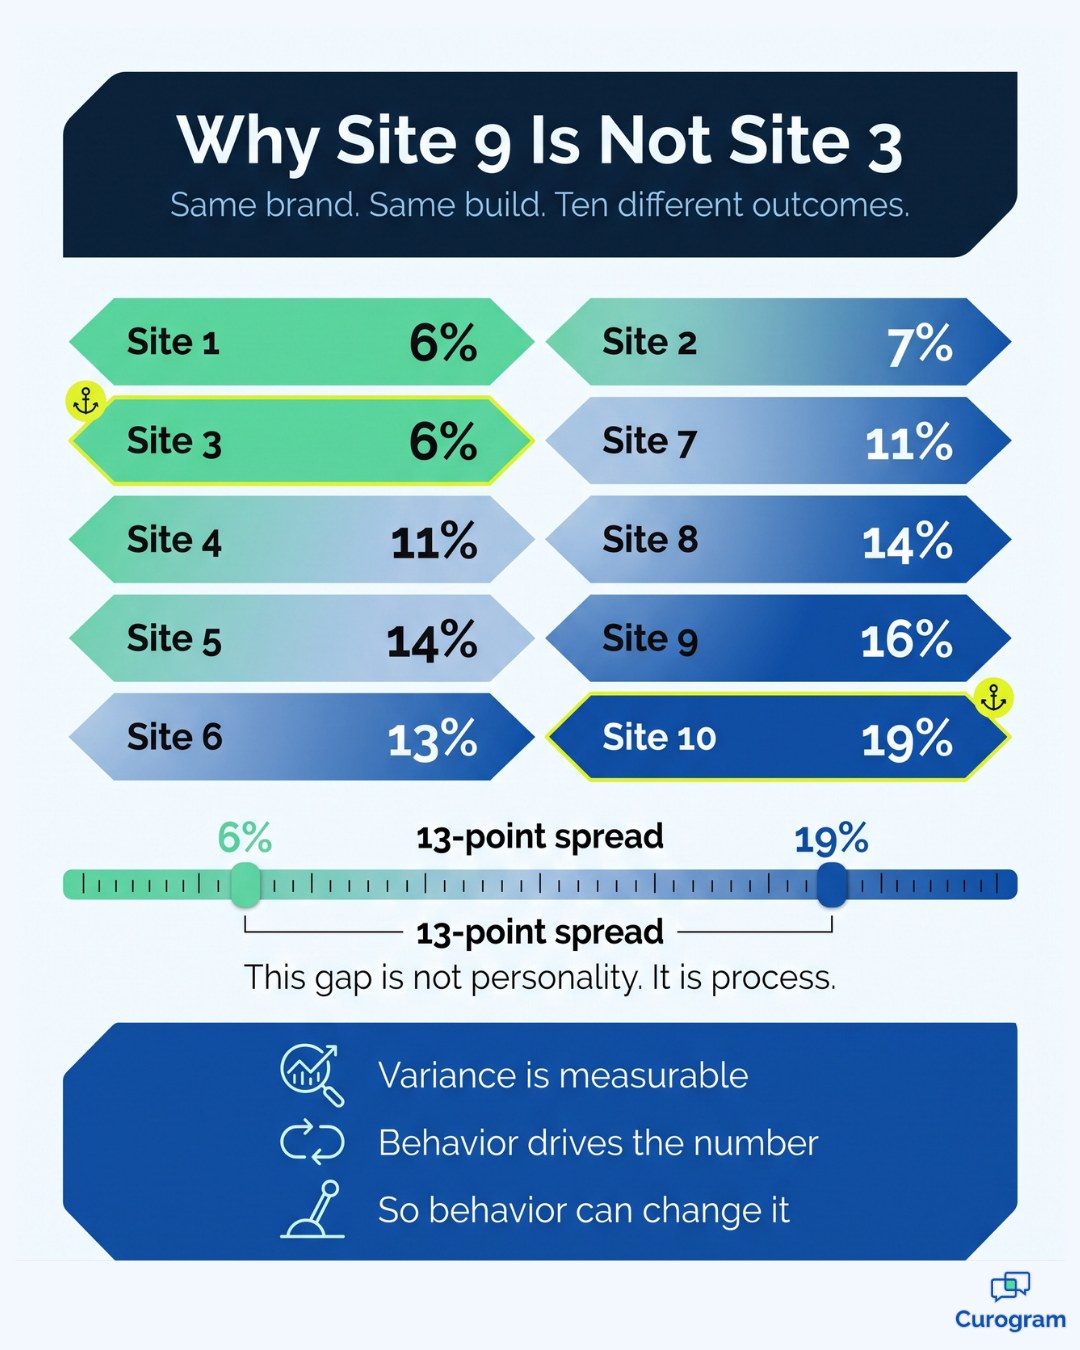
The spread between locations tells you the most. When Site 3 runs 6% and Site 9 runs 19%, that spread is your no-show variance operations metric, and it deserves a permanent line on the regional dashboard.

Variance is not a personality difference between offices. It is proof that behavior drives the outcome, which means behavior can change it.

Without that number, though, each site manager fights the problem using whatever habits took root locally. A win at one office stays at that office, and the network never compounds anything.

Variance map of no-show rates across 10 eClinicalWorks multi-location clinic sites

Turning Your Best Site Into the Network Default

Curogram works as a reminder policy engine. It takes the discipline of your strongest location and makes it the standard everyone runs, without ten separate setup projects.

Four pieces do the work.

Two-Way Confirmation Logic

Patients reply to confirm, cancel, or reschedule. A one-way blast tells you nothing until check-in, when it is far too late to refill the slot.

A reply changes the timing completely. A cancellation that lands 36 hours out is a slot you can still sell. The same cancellation discovered at 8:55 a.m. is just an empty room and a provider wivth a gap.

That timing difference is the whole game. You are not trying to talk patients out of canceling. You are trying to learn about it early enough to do something useful.

Instant Write-Back to the eCW Schedule

Every confirmation, cancellation, and reschedule posts straight to the eCW resource schedule. Your staff never retype a status or check a second screen to find out who is coming.

That keeps the front desk confirmation workflow eCW users already know completely intact. The screen looks the same. It is just finally telling the truth in real time.

Call center agents and site staff then work from one live schedule, instead of arguing about which system is current.

One Governed Sequence, Not Ten Local Ones

Timing, wording, and cadence get set once and pushed everywhere. Site 9 stops improvising because Site 9 no longer has to.

This is the part of a no-show reduction playbook medical network operators keep skipping. They buy the messaging tool, let every location configure it differently, and the variance survives the purchase untouched.

Weekly Per-Location Benchmarking

Regional administrators get confirmation and no-show rates by site, every week. That turns a tool into a management cadence, which is the part most software never delivers.

The question shifts from "are we working on no-shows?" to "why is Site 7 two points behind Site 3?"

Only one of those questions has an answer you can act on.

What Changes When Every Site Runs the Same Sequence

The results show up in three places, and they build on one another.

  • No-show rates land 53% below the industry average for groups on the sequence
  • Recovered visits drive a 10% to 20% revenue increase
  • Confirmation rates run above 75% across current Curogram clients
  • Atlas Medical Center cut no-shows from 14.20% to 4.91% in three months

Atlas gives you the clearest picture of the shift. Cutting a no-show rate by roughly two-thirds is not about sending more messages. It means the messages going out finally get answered.

For your team, apply that to the table above. Trimming a ten-site group's monthly loss by half returns more than $1.3 million a year to the schedule, and it arrives as visits rather than as a cost-cutting exercise.

The operational change matters just as much as the money. You move from site-by-site firefighting to one sequence and one weekly benchmark, and no-show management stops being a recurring fire drill.

It becomes routine operations. Boring, in the best possible way.

Freed slots get refilled while there is still time to fill them. Provider utilization climbs without adding a single hour to anyone's day, because you are selling capacity you already paid for.

The five-figure leak turns back into visits.


Put One Name Next to the Network Number

No-shows are a network number. You cannot fix a network number with ten local efforts and hope they add up to something.

They never do.

Your eCW build protects your schedule. It holds the slots, the providers, and the rooms exactly where they belong. What it cannot hold is the other half of the equation, which is the patient's decision to actually show up.

That decision gets made on a phone, hours before the visit, and it is won or lost by the message you send.

So split the job cleanly. eCW is responsible for your schedule integrity. Curogram is responsible for their commitment to walk through the door.

The move this month is not really a technology decision at all. Assign one person to own the network no-show number. Give them a weekly report by location, the power to set one reminder sequence for every site, and the tooling to enforce it without ten setup projects.

Then watch the spread begin to close.

Your strongest location stops being a lucky outlier and becomes the documented standard. Your weakest stops being a mystery and becomes a gap you can measure, explain, and fix.

Most groups see confirmation rates move within the first few cycles of a new sequence. Meaningful no-show improvement usually follows inside the first month, and it appears per location, exactly where an operations leader can act on it.

The leak has been running quietly for years. Closing it does not require a new EHR, a hiring plan, or a change management push that eats your whole quarter.

It requires one sequence, one owner, and one number nobody is permitted to ignore.

Schedule a Demo and we will compute your per-location leak using your own utilization data, then model what recovery looks like across every site you operate.


Frequently Asked Questions

How is this different from the reminders already built into eCW?

eCW reminders are set up location by location. There is no governance layer, and no easy way to compare one site against another. Curogram applies one proven sequence across the whole network, adds two-way confirmation replies, and reports results per location every week. Everything still writes back to eCW, so your schedule stays the single source of truth.

Will patients get annoyed by more messages?

A governed sequence usually sends fewer messages than an ad-hoc setup, not more. The timing is planned once instead of duplicated across tools. Two-way replies also let patients fix a conflict in seconds rather than skipping the visit. Opt-out rates on well-run sequences stay low.

How quickly will we see results?

Confirmation rates usually move within the first few cycles of the new sequence. Most groups see clear no-show improvement inside the first month. It shows up per location on the benchmark dashboard. That per-site view matters, because it tells you which offices picked up the sequence and which ones need a nudge.

Do we have to roll this out to every location at once?

No. Most networks start with two or three sites, check the lift against their own baseline, then expand. The governance model is what makes that expansion quick. You are copying a proven sequence instead of building a new one.

Who should own the no-show number?

One person at the regional or network level, usually a director of operations. The job is not to work the phones. It is to read the weekly report by location, spot the outliers, and hold every site to the same sequence.