
 Jo Galvez
The Science of Reminder Timing: How Data Closes Schedule Leaks
💡 Most practices send appointment reminders at a fixed time before every visit. But this one-size-fits-all approach often misses the mark. When a...

Empty appointment slots are a quiet budget crisis. Most practice managers know their overall no-show rate. Few know which specific slots are driving most of that loss.
The difference matters more than it sounds.
A practice with an 18% no-show rate might have 9% on Monday mornings and 31% on Friday afternoons. Knowing that split is the difference between guessing and acting.
Most practices respond to high no-show rates by adding outreach. More calls. More texts. More staff time. Yet no-show rates barely move.
That is because the issue is not how much you remind patients. It is when you remind them, and whether you can see the patterns driving the problem.
This guide lays out a data-driven approach to reducing patient no-shows in your medical practice. You will find specialty benchmarks, a look at the operational levers that matter most, and a 90-day roadmap grounded in real client outcomes.
The financial drain of no-shows is well-documented. What is less obvious is why most practices keep losing the same ground month after month. The answer lives in the data most practices never look at.
Monthly reports give you a single number: your overall no-show rate. That number feels useful until you realize it hides everything that matters.
An 18% overall rate could mean 9% on Monday mornings and 31% on Friday afternoons. Or 12% for follow-ups and 28% for new patients. The aggregate tells you there is a problem. It does not tell you where to fix it.
That gap in visibility is what keeps practices stuck in reactive mode. When you cannot see the pattern, every slot feels equally at risk. So practices apply the same reminder logic to every appointment, regardless of when it falls or who it is for.
The result is a lot of outreach and not enough improvement.
When practices look at no-show data across time of day, day of week, provider, and appointment type, a structure emerges. Friday afternoon slots may show no-show rates 15 points above the practice average. New patient appointments may run twice the rate of follow-ups.
That structure is where recoverable revenue lives. A practice losing $25,000 per month to no-shows is not losing it evenly. Most of it concentrates in a handful of high-risk slots. Finding those slots is the first step toward fixing the problem.
Reactive schedule management means adding resources without changing the approach. More staff on phones. Longer call windows. Additional text blasts sent to everyone.
Practices in reactive mode often see modest gains at first, typically 2 to 4 percentage points. Then the improvement stalls. That is not because reminders do not work. It is because sending more reminders to the wrong people at the wrong time has a ceiling.
Based on Curogram client data from clinical settings, practices that shift from volume-based outreach to timing-based, data-driven workflows achieve a 15% average reduction in no-show rates within 90 days. That is not from hiring more people. It is from using the data they already have.

Hiring more staff to make reminder calls feels like progress. But if the structure of your outreach does not change, neither will your results. This section explains why no-show prevention strategies live in data, not headcount.
Instead of asking 'how many reminders should we send,' data-driven practices ask a different set of questions. Which reminder windows produce the highest response rates? Which slots have the most concentrated no-show risk? Which patient segments need a different approach?
One mid-sized family practice found that Friday afternoon appointments had a 22 percentage point higher no-show rate than Monday morning slots. The reactive answer would have been more calls. The data-informed answer was to shift the reminder window from 24 hours to 72 hours for Friday slots.
No new staff. No expanded hours. Within two months, the Friday afternoon no-show rate dropped 22 percentage points. The practice eliminated the day-of-week variance entirely by changing timing, not volume.
Effective no-show prevention relies on four types of data working together:
When these four inputs are visible in real time, you stop guessing about what to change. You see it.
Standard EHR reports are built for billing. They produce aggregate metrics in compliance formats. They are not designed to show you confirmation rates by reminder send-time or no-show density by hour of the day.
That operational layer is what appointment confirmation software for medical practices adds on top of EHR data. It surfaces the patterns that billing-focused tools were never built to find. And it is those patterns, not raw headcount, that determine how much recoverable revenue a practice can get back.
No-show rates are not the same across all specialties. Knowing your benchmark tells you whether your current rate reflects normal specialty behavior or a gap you can close. Here is how industry averages compare to Curogram client performance across seven specialties.
The table below shows the no-show rate by specialty benchmark for both the broader industry and for Curogram practices. These numbers come from Curogram client data from clinical settings alongside published industry norms.
|
Specialty |
Industry Average |
Curogram Clients |
|
Primary Care |
19% |
14.11% |
|
Pediatrics |
30% |
14% |
|
Psychiatry |
23% |
11.03% |
|
Radiology |
18% |
8% |
|
Dermatology |
25% |
9% |
|
Pain Medicine |
14% |
10% |
|
Specialty Clinics |
23% |
10% |
Across every specialty, Curogram practices achieve no-show rates 53% lower than the industry average. That gap holds across different practice sizes and regions.
Some specialties carry higher baseline no-show rates by nature. Pediatrics at 30% and Psychiatry at 23% are higher than Radiology or Pain Medicine. But every specialty shows a significant gap between industry average and Curogram performance.
A Pediatrics practice running at 25% no-shows is 11 points above the Curogram benchmark. At 40 appointments per day and a $150 average reimbursement, that gap represents roughly $8,000 to $12,000 in recoverable monthly revenue.
That number is the financial case for acting on no-shows. It also explains why patient no-show prevention strategies need to be specialty-specific, not one-size-fits-all.
Benchmarks do more than set a target. They help you understand whether your no-show rate is a specialty characteristic or a process gap. A Dermatology practice at 20% is 11 points above the Curogram benchmark. That gap is not inherent to the specialty. It is a sign that the reminder timing, confirmation workflow, or both need adjustment.
The benchmark is also a useful internal metric for multi-specialty groups. Each department can track its own rate against the right specialty norm, rather than comparing Psychiatry to Radiology, which is not a fair comparison.

The shift from reactive gap management to predictive appointment intelligence is not a single change. It happens across three levers that work together: visibility, timing, and automation. Each one builds on the one before it.
A heatmap overlays all appointments across a weekly grid and color-codes no-show density. Think of a 40-cell grid: five days by eight time blocks. Most practices show clear clustering. Friday afternoons glow orange. Monday mornings stay blue.
Standard EHR reporting cannot surface this. It reports an aggregate. The heatmap shows the structure underneath that number. That structure is where leverage lives.
Once you know that 60% of your no-shows are concentrated in six specific time slots, you stop treating every appointment the same way.
You target those six slots first. That is medical practice schedule optimization in practice: not changing everything, just changing the right things.
Sending a reminder is not the same as sending it at the right time. Confirmation data reveals when patients are most likely to respond.
One practice found that routine follow-up appointments hit 78% confirmation when reminders went out 48 to 72 hours in advance. The same reminder sent 24 hours out got only 45%. New patient appointments needed an even longer window: 96 to 120 hours, with two touchpoints.
That kind of timing precision is not possible when all appointments get the same reminder schedule. Appointment confirmation software for medical practices makes it possible by treating appointment type as a variable and using confirmation data to define the optimal window for each one.
When a patient replies to a confirmation text, that response has to go somewhere. In most practices without automation, a staff member reads the reply, opens the EHR, finds the appointment, updates the status, and logs the confirmation. Multiply that by 40 appointments a day.
Covina Arthritic Clinic now processes more than 1,100 automated confirmations per month. That volume would require three to four full-time staff members if done manually. With automation, the response is captured, the appointment status is updated, and the confirmation is logged without any manual steps.
Atlas Medical Center applied all three levers together. Heatmaps revealed where no-shows clustered. Timing optimization adjusted reminder windows by appointment type. Automation handled confirmation logging. The result: their no-show rate dropped from 14.20% to 4.91% in three months, three times better than the industry average.
Knowing the levers is one thing. Knowing how to activate them in order is what gets you to results within 90 days. This roadmap reflects the pattern seen across Curogram practices that hit the 15% average no-show reduction benchmark.
Start with data review, not automation. Pull heatmap data and ask three questions. Which time slots show the highest no-show density? Which providers or appointment types vary most from your practice average? Which patient segments show the widest gap?
This phase takes two to four hours of staff time. It costs nothing beyond attention. But it is the most important step because it tells you where to act and in what order.
Skipping this phase is the most common implementation mistake. Practices that jump straight to automation without first understanding their patterns apply the same reminder logic everywhere. That is reactive mode with a faster engine. It still hits the same ceiling.
Once you know which segments carry the most no-show risk, adjust the reminder window for those segments first. If Friday afternoon slots run 15 points above your practice average, pull the confirmation data for Friday appointments. What timing produced the best response rate?
If that window is 72 hours rather than 24, shift the Friday reminder to Tuesday instead of Thursday. If new patients show twice the no-show rate of established patients, test a two-touchpoint workflow starting 96 to 120 hours out.
Track each change. The question is not just whether no-show rates drop but whether confirmation rates rise first. Rising confirmation rates are the leading signal. No-show reduction follows.
With timing optimized, activate the automated confirmation workflow. This means the full sequence: reminder sent at the optimal window, patient response captured, appointment status updated in the EHR, and daily fill rate report generated.
This is where how to reduce no-show rates in healthcare becomes self-sustaining. The workflow runs without manual transcription. Staff capacity shifts from reminder logistics to patient care.
By day 90, Curogram practices hit a 15% average no-show reduction. Practices that complete the discovery and timing phases in the first two to four weeks tend to reach 20 to 22% reduction by that same point. A practice losing $25,000 per month to no-shows recovers $3,750 in incremental monthly revenue in the first quarter alone.

Patient no-shows are not random. They follow patterns. And patterns can be found, measured, and fixed.
The practices that reduce no-show rates most effectively do not simply send more reminders. They identify where no-shows concentrate. They adjust reminder timing by appointment type. They use automation to remove manual work and scale what works.
Atlas Medical Center went from 14.20% to 4.91% in three months. Covina Arthritic Clinic processes over 1,100 confirmations a month without adding staff. These are not outliers. They are what happens when a practice stops guessing and starts using its data.
The specialty benchmarks in this guide show where your practice likely stands today. The gap between your current rate and the Curogram benchmark is not a fixed cost. It is recoverable revenue.
If you want to see what that looks like for your specific practice, a free walkthrough of your practice data is a good place to start.
Book a Free Practice Data Walkthrough
Frequently Asked Questions

💡 Most practices send appointment reminders at a fixed time before every visit. But this one-size-fits-all approach often misses the mark. When a...

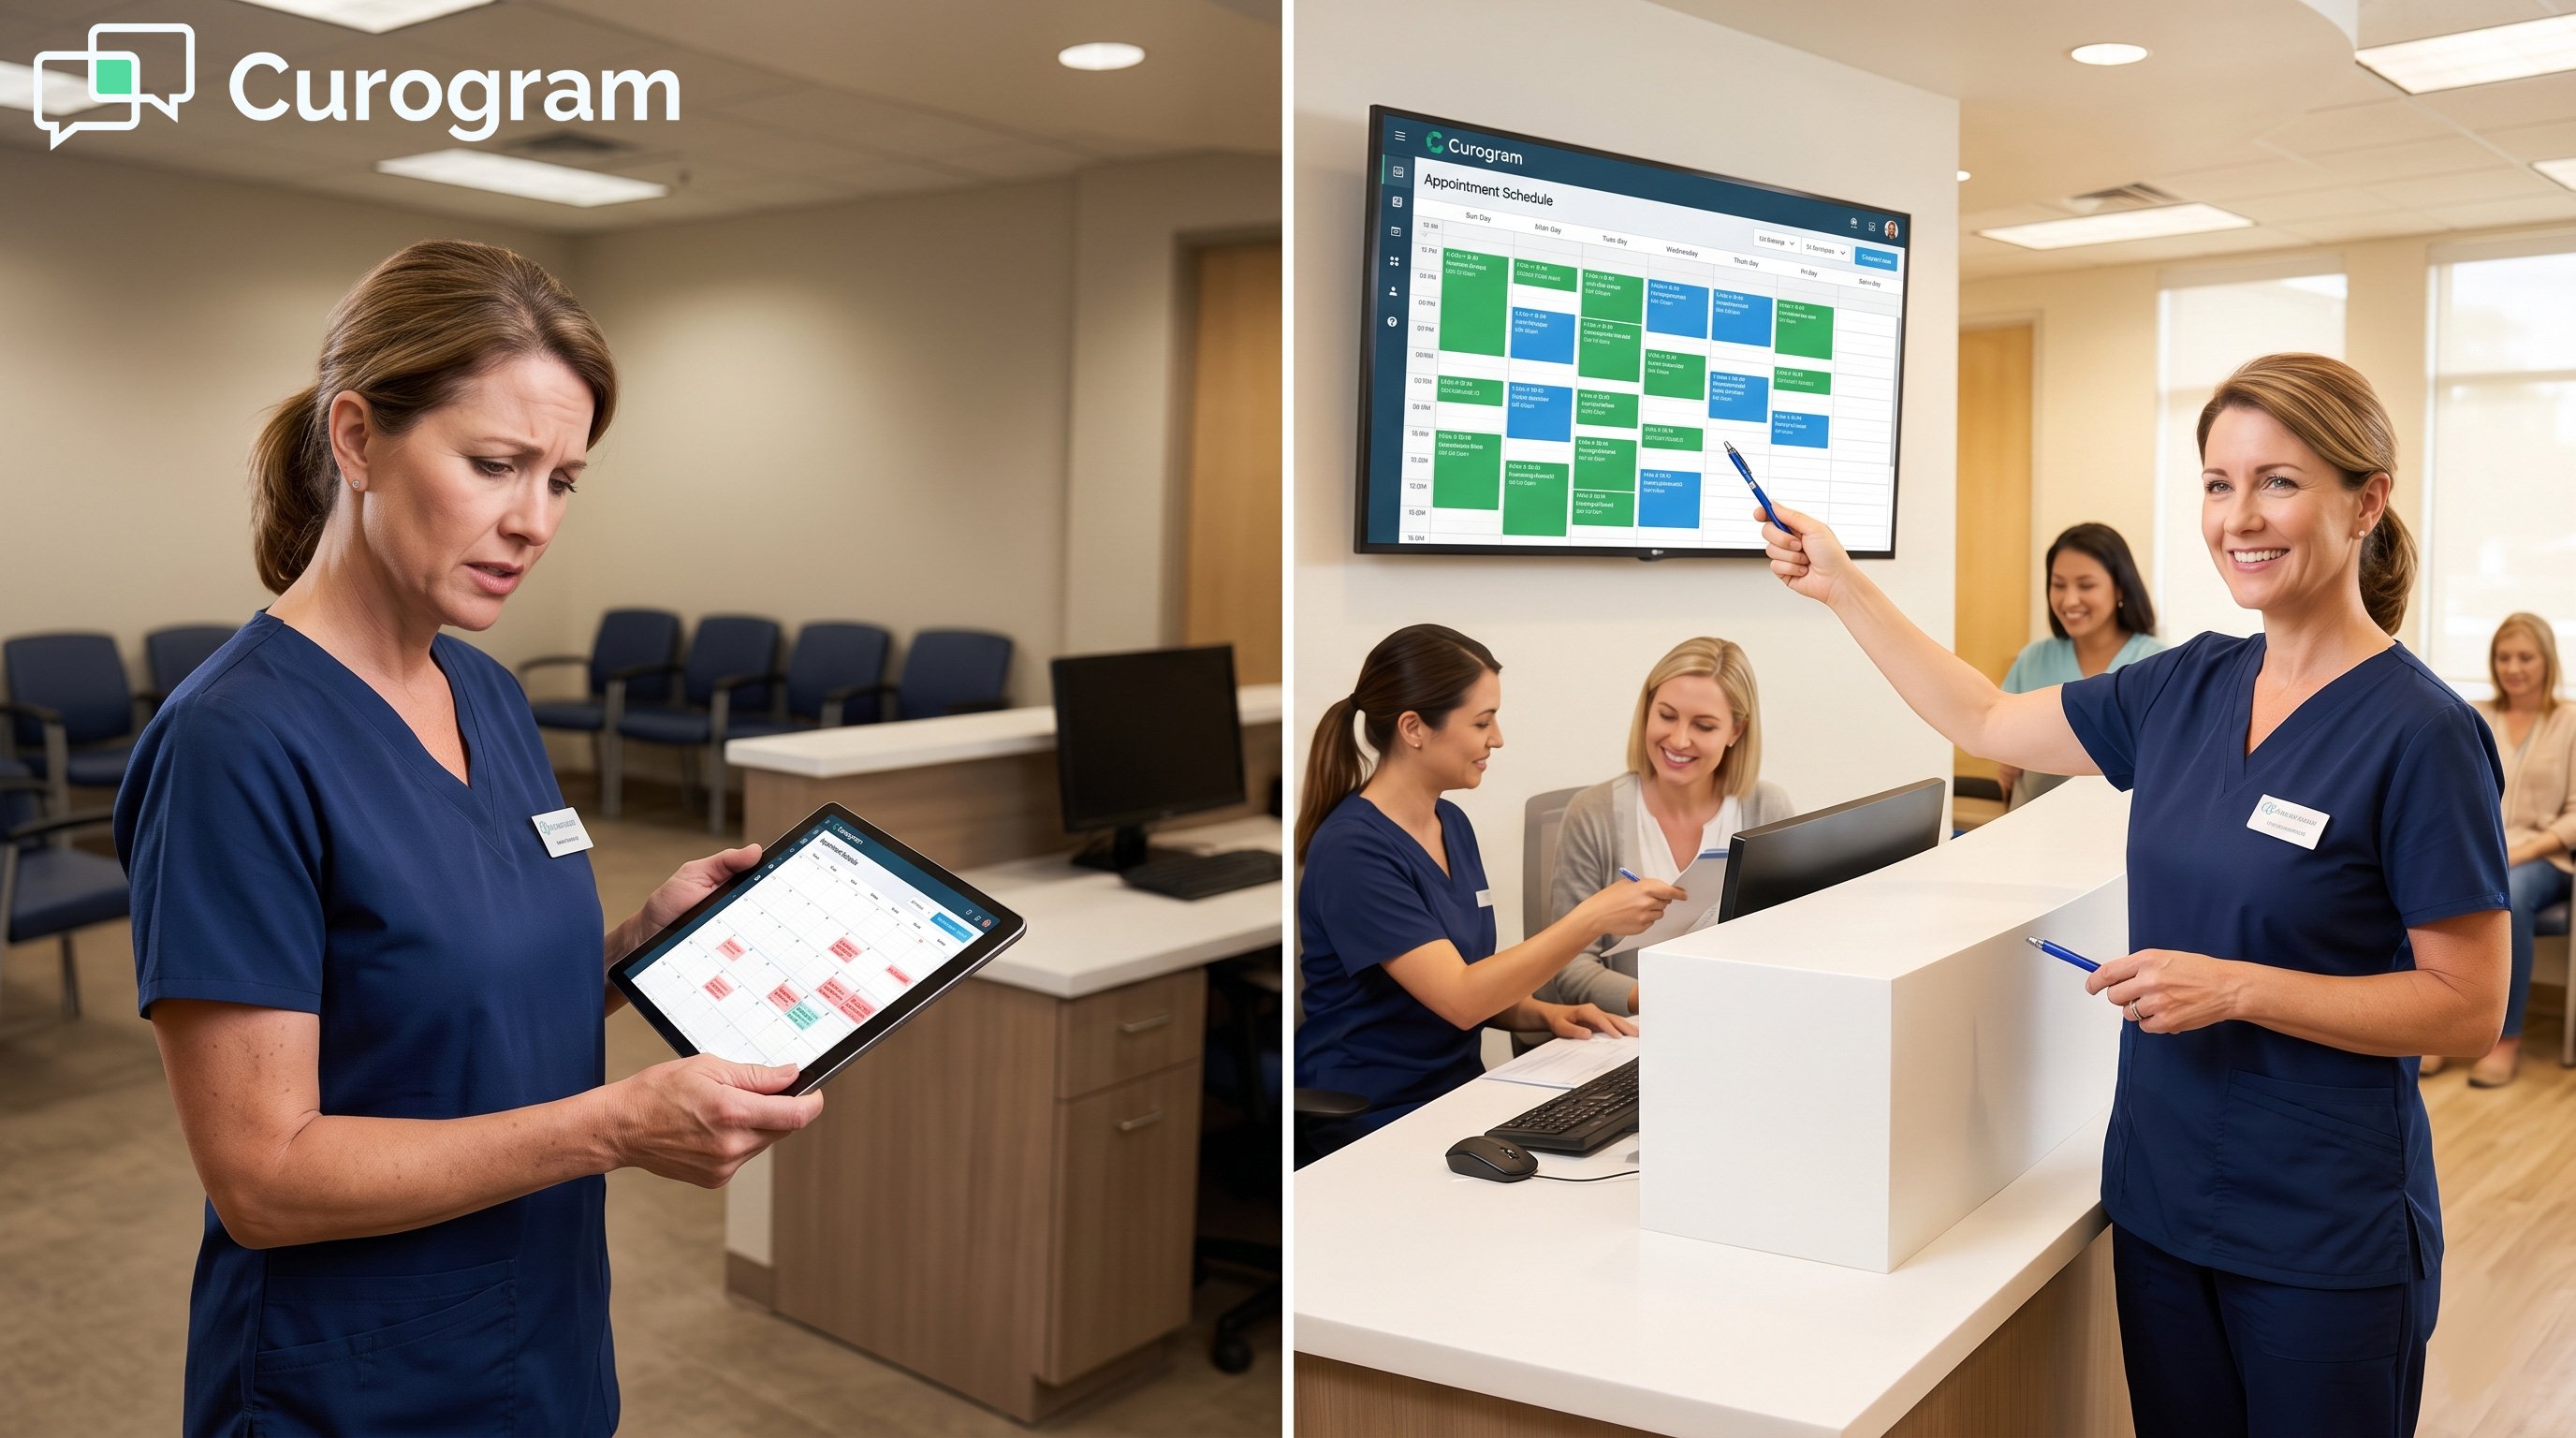
💡 Appointment scheduling analytics using a heatmap gives medical practices a visual way to find no-show patterns. Standard EHR reports show one...
💡 Patient no-shows cost medical practices $20,000 to $30,000 per month in lost revenue. That number comes from four cost layers: direct lost fees,...