
1 min read
Patient Sign In Sheet Printable
💡 Patient satisfaction in healthcare is a patient's own rating of their full care experience. It measures the gap between the care they expected...
12 min read

Most patient satisfaction surveys fail before anyone reads a single answer. Not because the questions were bad, but because the survey went out eleven days after the visit, by email, with sixteen questions, and the four people who finished it were already your happiest patients.
That's the real problem with patient feedback in most practices: the collection is fine and the follow-through is broken. A survey only earns its keep when it produces a change your patients can see.
We've watched this play out across hundreds of clinics. The pattern is consistent. A practice writes a thorough survey, sends it through whatever channel is cheapest, gets a 6% response rate, averages the scores, and files the report.
Next quarter, same survey, same 6%, same file. Nobody at the front desk ever learns that patients found the check-in confusing, because the comment that said so was on page three of a PDF nobody opened.
The practices that get real value do something narrower. They pick two problems they can actually fix this quarter. They write six to ten questions that measure only those.
They send by text within 48 hours, while the patient still remembers the wait and the person who explained their bill. Then they read the comments, change one thing, and tell patients about it.
Based on our internal data, that consistency compounds. One Curogram client went from a 1.67-star rating to 5.0 and grew from 101 reviews to 479, while inbound calls dropped 24%.
This guide gives you 55+ patient satisfaction survey questions organized by category, the scales that make them usable, the delivery method that actually gets answers, and what to do with the results once they land.
A patient satisfaction survey is a formal method for measuring how well you're meeting patient expectations. It asks about specific moments in the visit, not general feelings about healthcare.
Most practices already collect feedback by accident. A complaint at the front desk, a one-star Google review, a patient who books elsewhere. A survey turns that scattered signal into something you can count and compare.
Listening on purpose changes what your team can fix.
Better clinical care. Feedback surfaces the specific gaps: a treatment plan nobody explained, pain that went unmanaged, a question the patient never got to ask. Those are fixable at the exam-room level.
Stronger retention. Patients who feel heard come back. They also refer, which costs you nothing.
Operational blind spots exposed. Long waits, a confusing check-in, a phone line nobody answers on Tuesdays. Staff often stop noticing these. Patients never do.
Staff accountability and morale. Positive comments read aloud in a Monday huddle do real work. Negative ones, handled correctly, point to training rather than blame.
Regulatory requirements. Hospitals report HCAHPS scores, which are tied to reimbursement and published publicly. Running your own survey between HCAHPS cycles tells you where you stand before CMS does.
Lower malpractice exposure. Patients who feel dismissed are more likely to sue when something goes wrong. Resolving a grievance early is cheaper than defending one later.
Financial performance. Loyalty, efficiency, and online ratings all feed the same bottom line.
Based on our internal data, practices that run structured review and feedback programs see real movement fast. One Curogram client rebuilt from a 1.67-star rating to a 5.0 rating, going from 101 reviews to 479, while cutting inbound calls by 24%.

An effective survey measures specific parts of the visit. Random questions produce random data.
Cover the full visit, not just the exam room.
| Dimension | What It Measures |
|---|---|
| Access to Care | Scheduling ease, appointment availability, office hours |
| Check-in and Waiting | Front desk courtesy, check-in speed, wait time |
| Facility Environment | Cleanliness, comfort, noise, parking |
| Communication with Doctors | Listening, respect, clear explanations, shared decisions |
| Communication with Nurses and Staff | Courtesy, response time, clarity |
| Treatment and Care Process | Exam thoroughness, confidence in the plan, pain management |
| Billing and Financials | Bill clarity, staff helpfulness, cost transparency |
| Discharge and Follow-Up | Instruction clarity, follow-up coordination, home readiness |
| Overall Experience | Summary rating, likelihood to recommend |
Billing and discharge get skipped most often. They also generate the most complaints.
The way you structure your answer choices is just as important as the questions you ask. The scale determines the type of data you collect and how you can analyze it.
The 5-point Likert scale is the most common and widely understood rating scale used in a patient satisfaction survey. It provides a balanced range of options for a respondent to express their level of agreement or satisfaction.
A typical 5-point satisfaction scale looks like this:
It works because it's easy to answer and easy to report. You can average the scores, or you can calculate a top-box score: the share of patients who chose Satisfied or Very Satisfied. That single number is usually what leadership wants.
| Scale | Best For | Trade-Off |
|---|---|---|
| 3-Point (Poor / Fair / Good) | Quick SMS pulse checks | Loses nuance |
| 7-Point | Granular research | Harder to answer, slower to complete |
| Semantic Differential | Perceptions of specific traits (Clean vs. Dirty) | Not comparable across questions |
| Net Promoter Score | Loyalty tracking | One question only, no "why" |
Net Promoter Score is a single question: On a scale of 0 to 10, how likely are you to recommend our facility to a friend or family member?
Subtract the % of Detractors from the % of Promoters. Passives count in the denominator but add nothing, which is why a practice full of 7s and 8s can post a warm-looking average and an NPS of zero.
Treat this as a menu, not a checklist. Pull the questions that match what you're actually trying to fix. Practices that use a patient satisfaction survey platform like Curogram can push a short version by text and route the responses without adding front-desk work.

Pick one thing you're trying to fix before you write a single question. Common goals:
A survey built around a goal gets used. A survey built around "we should probably survey people" gets filed.
Before you send out a single survey, ask your team: "What are we trying to achieve?" Your goals will dictate your questions, timing, and methodology. Are you trying to:
Clear goals make the entire process more focused and ensure you're collecting data that will actually be used.
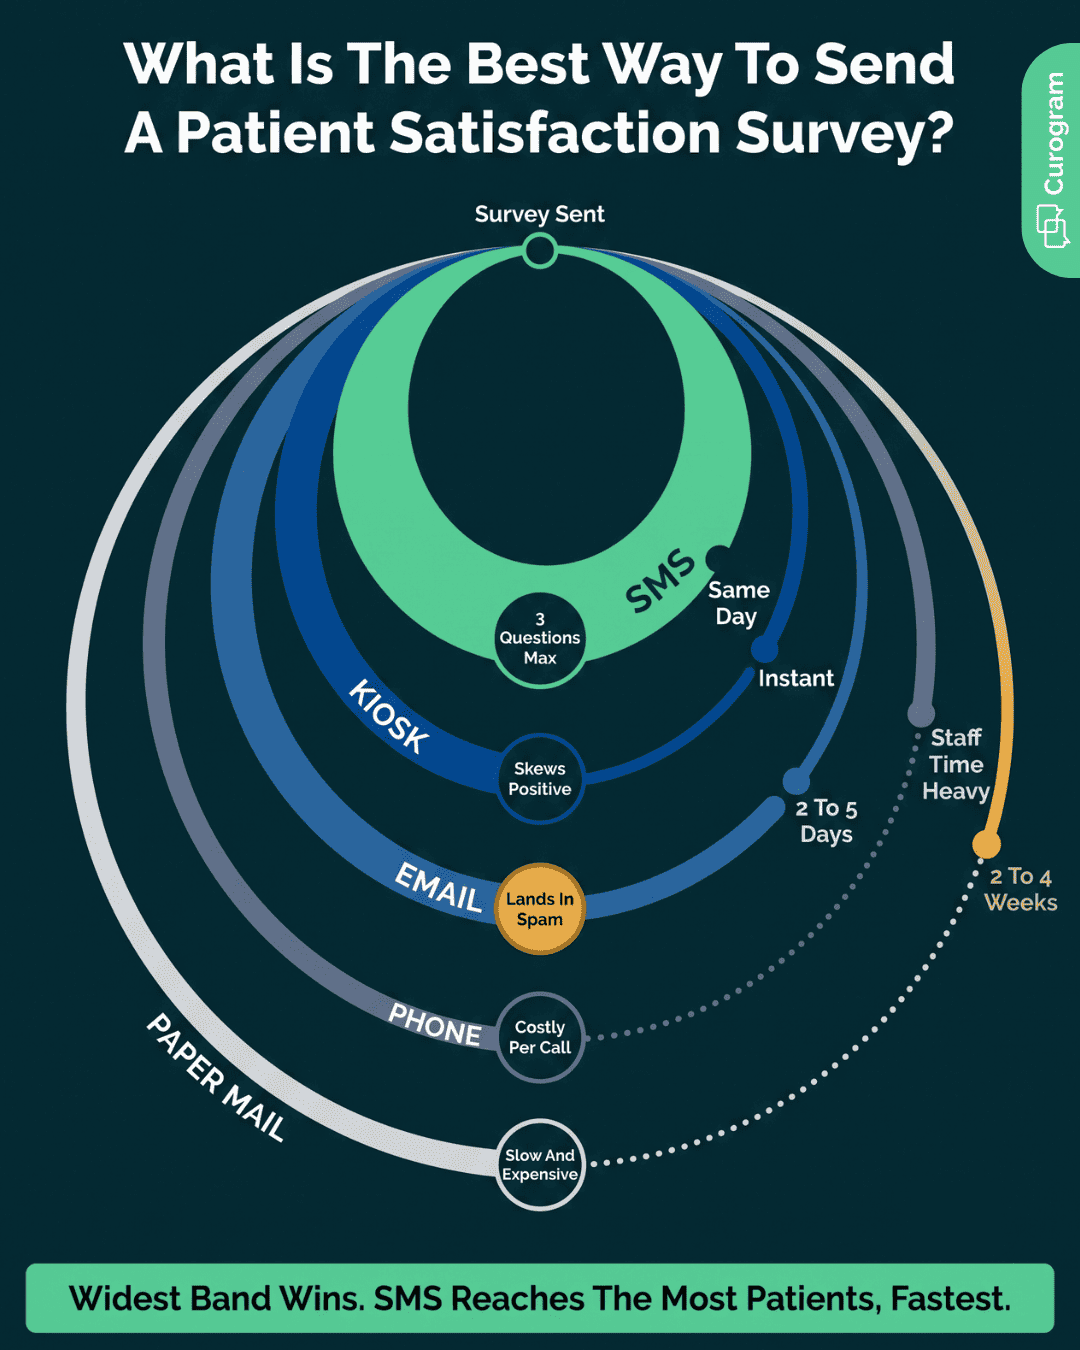
Delivery method drives your response rate more than question wording does.
| Method | Strength | Limit |
|---|---|---|
| SMS/Text | Highest response rate, immediate, near-zero cost | Must stay at 1–3 questions |
| Cheap, allows longer surveys, easy to automate | Ignored or filtered to spam | |
| Kiosk/Tablet | Captures sentiment in the moment | Skews positive; not anonymous |
| Reaches patients without internet access | Slow, expensive, low return | |
| Phone | Rich, detailed answers | Costly in staff hours, can feel intrusive |
Most practices land on a two-channel setup: a short text survey for everyone, and a longer email version for patients who want to say more.
Follow these rules to ensure your survey is effective and professional.
Keep it short. Three to five minutes, maximum. Ten to twelve questions on email, three on text.
Write plainly. Aim for a 6th-grade reading level. No acronyms, no clinical terms, no compound sentences.
Don't lead the witness. "How would you rate our excellent care?" pre-loads the answer. Ask "How would you rate the quality of care you received?" instead. A leading question doesn't collect data. It manufactures a number you can't act on.
Group by topic. All scheduling questions together, all provider questions together. Start easy, get specific.
Test it first. Send it to five staff members and two trusted patients before launch. You'll catch a broken scale or an ambiguous question every time.
Timing is everything. You want to send the survey when the experience is still fresh in the patient's mind.
Timing. Send within 24 to 48 hours of an outpatient visit. For hospital stays, send within 72 hours of discharge. After that, patients remember the diagnosis and forget everything else.
Frequency. Cap it. Once every 90 days per patient, no matter how often they come in.
The invitation. Say who it's from, why you're asking, and how long it takes. "This takes under 2 minutes and helps us improve your care" outperforms a bare link.
Patients won't tell you the truth if they think it follows them into the exam room. State plainly, in the first line, that responses are confidential and will not affect their care.
If the survey is genuinely anonymous, say that too. Honest negative feedback is the whole point of the exercise, and this one sentence is what buys it.
Data you don't act on is worse than no data. It costs staff time and teaches patients that feedback goes nowhere.
Your survey returns two kinds of data, and most practices only look at one of them.
The scale answers give you the what. Average each question, then calculate your top-box score: the share of patients who chose Satisfied or Very Satisfied. Track both against last quarter. A 4.2 that used to be a 4.6 is a problem hiding inside a perfectly respectable score.
The open-ended comments give you the why, and they're usually the most valuable thing in the file. Sort them into themes such as Wait Times, Staff Friendliness, or Billing Confusion. Note whether each theme skews positive or negative. Then pull two or three anonymous quotes to bring into your next team meeting. A number gets nodded at. A quote gets remembered.
| Data Type | What It Tells You | How to Use It |
|---|---|---|
| Scale answers | The size of the problem | Averages, top-box %, quarter-over-quarter trend |
| Written comments | The cause of the problem | Themes, sentiment, quotes for staff meetings |
Almost everyone skips this part, and it's the reason response rates fall off a cliff by the third survey cycle.
Start by sharing every result with the whole team, not just the flattering ones. Front desk, clinical, billing, leadership. Then assign a small group to one problem at a time. If wait times are the theme, have them map the current check-in process and find where it stalls.
The last step is the one nobody does: tell patients what changed. Post it at the front desk, text it, put it in the newsletter. "You told us check-in was slow. We moved intake forms to text, and average wait is down 9 minutes." Patients who never hear back assume nothing happened, and they stop answering.
A 4.2 out of 5 means nothing on its own.
Compare it against your own last quarter first. Direction matters more than the absolute number, and internal trends are the only benchmark you fully control. For outside context, the Agency for Healthcare Research and Quality (AHRQ) publishes HCAHPS data you can measure hospital performance against.
Most practices don't have a survey problem. They have a follow-through problem. The questions get written, the results come back, and the file sits in a shared drive while the schedule fills up again.
So start smaller than you think you should. Pick two things you can actually change this quarter, whether that's the check-in bottleneck or the billing calls nobody enjoys taking. Write six to ten questions that measure them.
Send by text within 48 hours of the visit, because that's the window where patients still remember the wait, the explanation, and the person who handed them the form.
Then read the comments. Not the averages, the comments. That's where the fix is. Fix one thing. Tell your patients you fixed it.
That last step is what separates a survey from a program, and it's the one that keeps response rates from collapsing by the third cycle. Patients answer again when they can see that answering did something.
The delivery side is where the work either gets easier or quietly stops. Text-based surveys that fire automatically after a visit, route the responses without adding front-desk work, and connect to the EHR you already use, that's the difference between a feedback loop that runs on its own and one that depends on someone remembering.
Request a demo now to see what a 48-hour text survey looks like from the patient side and from your dashboard.

1 min read
💡 Patient satisfaction in healthcare is a patient's own rating of their full care experience. It measures the gap between the care they expected...

1 min read
💡 Patient satisfaction in healthcare is a patient's own rating of their full care experience. It measures the gap between the care they expected...
1 min read
💡 Patient satisfaction measures how a patient felt about their visit. It compares the care they received against what they expected to receive....